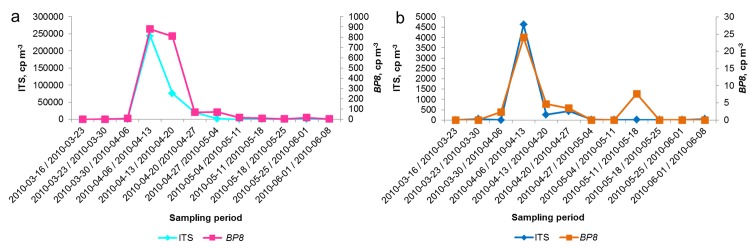
Fig 1. DNA quantification via qPCR measurements.

DNA concentrations in copies m-3 (cp m-3) are given for the multi-copy ITS region and single-copy BP8 gene for coarse (a) and fine particle filter samples (b) DNA copies m-3 are given for ITS quantification on the primary vertical axis, and on the secondary vertical axis for the BP8 gene. The x-axis shows the time, 2010-03-16 / 2010–0608, during the birch-specific pollination period.
