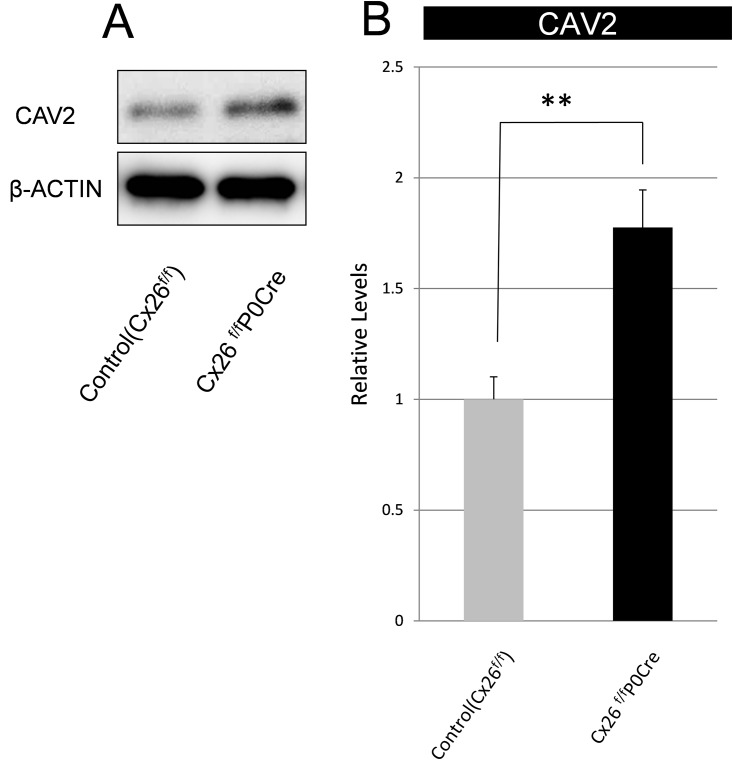
Fig 6. Protein expression level of CAV2.
(A) Western blotting revealed an increase in CAV2 level in Cx26f/fP0Cre mice at postnatal day 21. (B) CAV level was normalized to that of β-actin and is expressed as relative to the amount present in each littermate control. Values represent the mean ± SE (n = 6 for control, n = 5 for Cx26f/fP0Cre). **P = 2.5×10⁻³ for CAV2, Student’s t-test.

