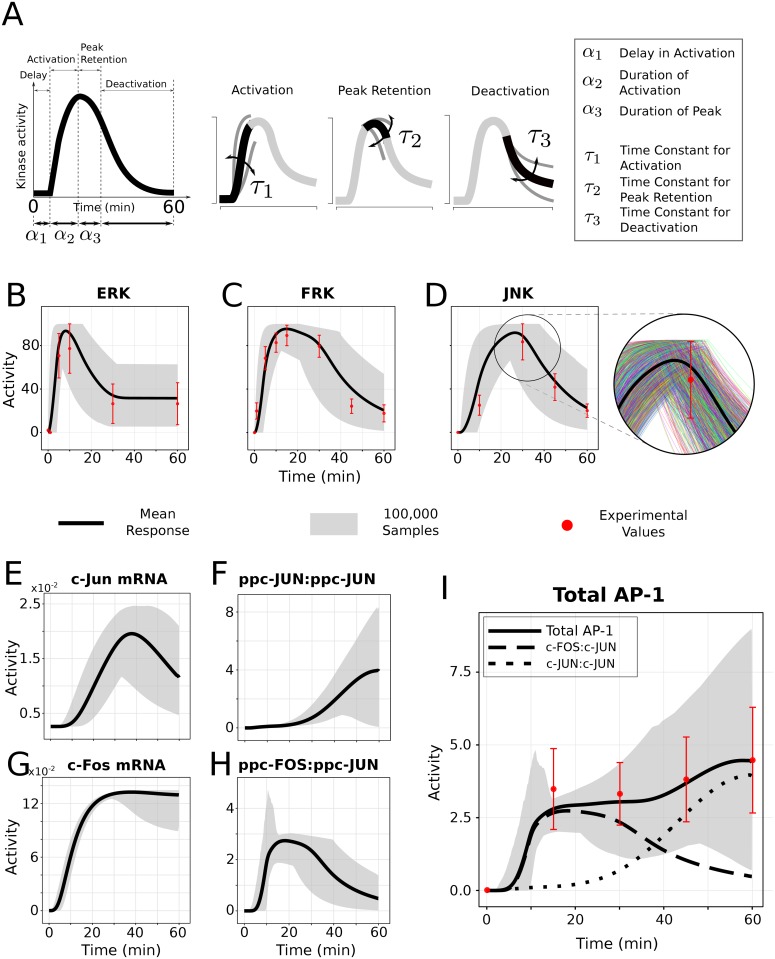
Fig 2. Functional information encoding through dynamical signaling features.
(A) Illustration showing independent temporal features of dynamics of a transient signaling kinase in the phases of delay, activation, peak retention and deactivation kinetics. (See Methods and Table 1 for details) (B, C and D) Simultaneous variability in all six temporal features encompasses (gray region in the plot) the observed experimental variations in ERK, FRK and JNK activation (red error bars), respectively. The gray region is based on a total of 100,000 simultaneous variations in all eighteen signaling features, generated using a differential variation schema reported in Table 1. The red points and error bars in the plots show experimental data from neuronal cultures incubated with Angiotensin II (100 nM) to activate AT1R signaling for 0–60 min at 37°C. Time course data for ERK is taken from [93], whereas for FRK and JNK time course observations are from [94]. The extended figure on the right of the JNK plot illustrates a subset of 100,000 random profiles (colored lines) filling the gray region and bounded within the red error bars. (E,F,G, H and I) Simulations results from 0 to 60 minutes for each unique combination of three signaling profiles (100,000 random samples in total) for downstream responses of immediate early genes c-Jun and c-Fos, and transcription factors ppc-JUN:ppc-JUN, ppc-FOS:ppc-JUN and Total AP-1. Experimental data for Total AP-1 time course observations are taken from [46].

