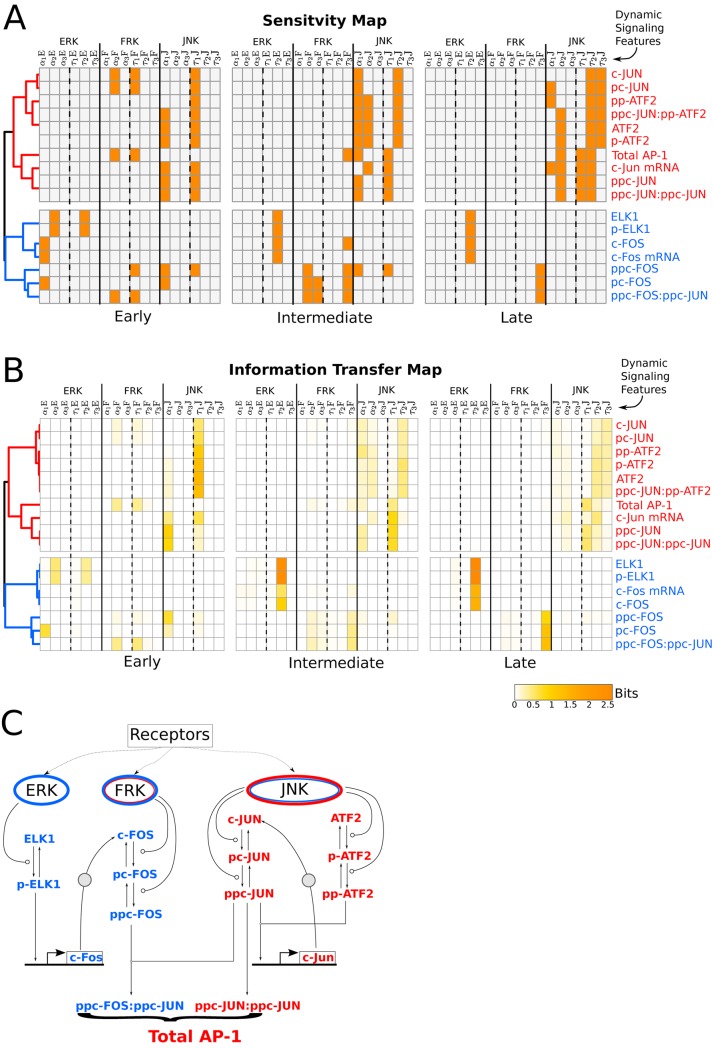
Fig 8. Patterns in sensitivity and information-transfer maps correlate with topological organization of the network modules.
(A) Heatmap of sensitive signaling features to each intermediary response species at snapshot measures of early (20 min), intermediate (40 min), and late (58 min) phases of the stimulation. Orange colored boxes in the map represents sensitive features (S i > 0.1), and gray color represents non-sensitive features(S i ≤ 0.1). Unsupervised hierarchical clustering (of Pearson correlation distance matrix) was performed on the heatmap, shown as dendrograms on the left. Clustering unwinds coherent feedforward and positive feedback network motifs shown as blue and red colored species, respectively. (B) Heatmap of mutual information between each feature and intermediary response species for snapshot measures at early (20 min), intermediate (40 min) and late (58 min) phases of the stimulation. The scale bar reports the estimated mutual information in bits. Unsupervised hierarchical clustering (Pearson correlation distance matrix) was performed on the heatmap shown by dendrograms on the left. (C) Gene regulatory network showing network motifs of feedforward interactions (ERK/FRK module) and positive feedback loop (JNK module) as blue and red, respectively.

