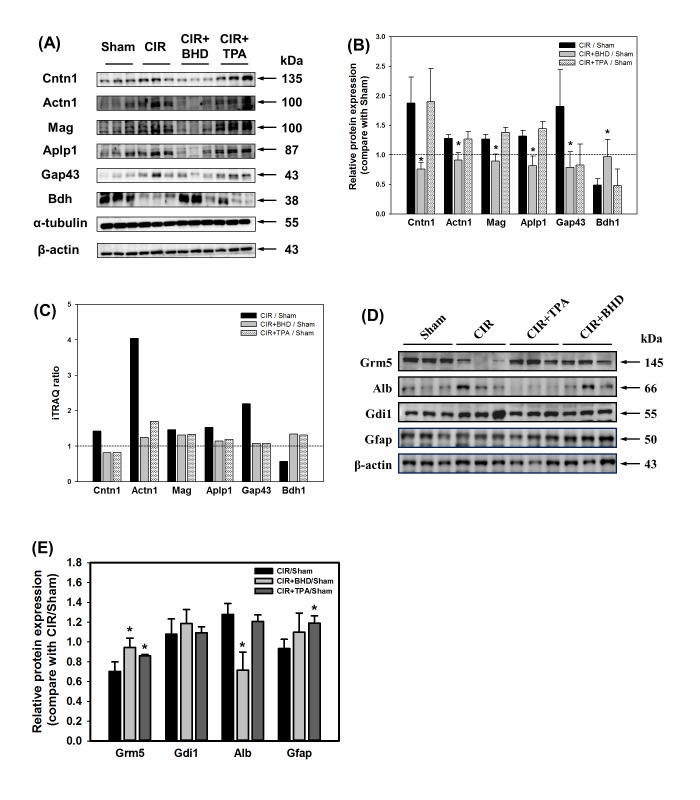
Fig 4. Validation of the selected proteins by western blotting.
(A) The levels of upregulated proteins (Cntn1, Actn1, Mag, Aplp1 and Gap43) and downregulated protein (Bdh) affected by CIR were recovered to the basal situation in the BHD-treated group (compared with the sham group). (B) Quantitative analysis of the selected proteins mentioned above. The values represent the ratio of the treatment group compared with the sham group, using α-tubulin as a loading reference. (C) The histogram indicates the ratio of the proteins selected in the iTRAQ experiment. (D) The levels of upregulated proteins (Alb and Gdi1) and downregulated proteins (Grm5 and Gfap) affected by CIR were reversed in the BHD-treated group (compared with the sham group). (E) Quantitative analysis of the selected proteins mentioned above. The values represent the ratio of the treatment group compared with the sham group, using β-actin as a loading reference. Data are presented as the mean ± S.D. Each protein expression with triplicates was statistically analyzed using Student t-test. *p < 0.05 compared with CIR/Sham.

