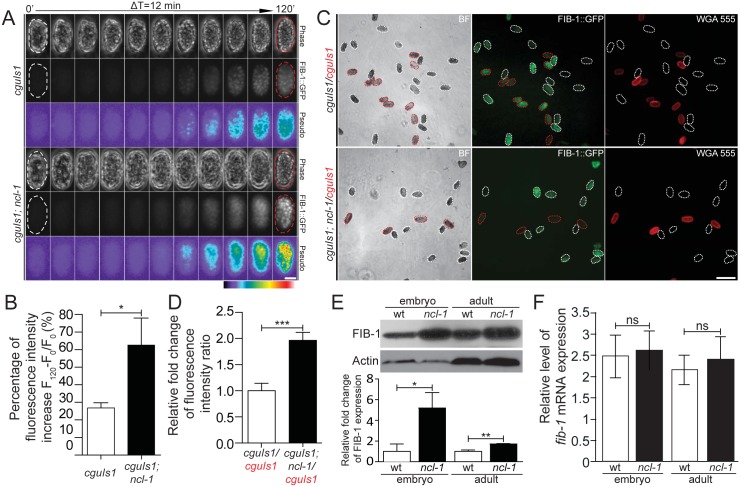
Fig 2. NCL-1 is a negative regulator of FIB-1 expression.
(A) Time-lapse imaging of embryos from the two indicated transgenic worms during early development, taken every 12 minutes. Both phase-contrast and green fluorescence (FIB::GFP) images are shown, with pseudo-colors depicting the degree of fluorescence intensity as indicated by a color bar. Scale bar, 20 μm. (B) Average fluorescence levels were quantitatively determined from the images in (A). The bar graph shows the percentage of fluorescence intensity increase between the initial and end-point time-lapse images for the indicated strains. *P < 0.05; n = 20–23 embryos. (C) Fluorescence images shown the FIB-1::GFP expression in different transgenic embryo pairs. Embryos of the indicated strains were labeled either with or without WGA 555 prior to mixture at an equal ratio (labeled strains are marked in red). Representative images are shown, with white and red dotted contours respectively marking WGA-negative and WGA-positive embryos (“BF”, bright field). Scale bar, 100 μm. (D) Quantitative image analysis for FIB-1::GFP expression in embryos shown in (C), illustrating the ratios of average fluorescence intensity between the indicated strains. Asterisk signifies the difference: ***P < 0.0001; n = 129–222 embryos. (E) and (F) Western blot and RT-qPCR analyses of FIB-1/fib-1 mRNA and Actin/actin mRNA (as control) in the wild-type (wt) or ncl-1 animals, at the embryo or adult stage. Relative levels of normalized FIB-1/fib-1 mRNA expression are quantified and presented below. The bar graph depicts means ± S.E.M.; *P < 0.05; **P < 0.005; ns, no significance; n = 3–5.

