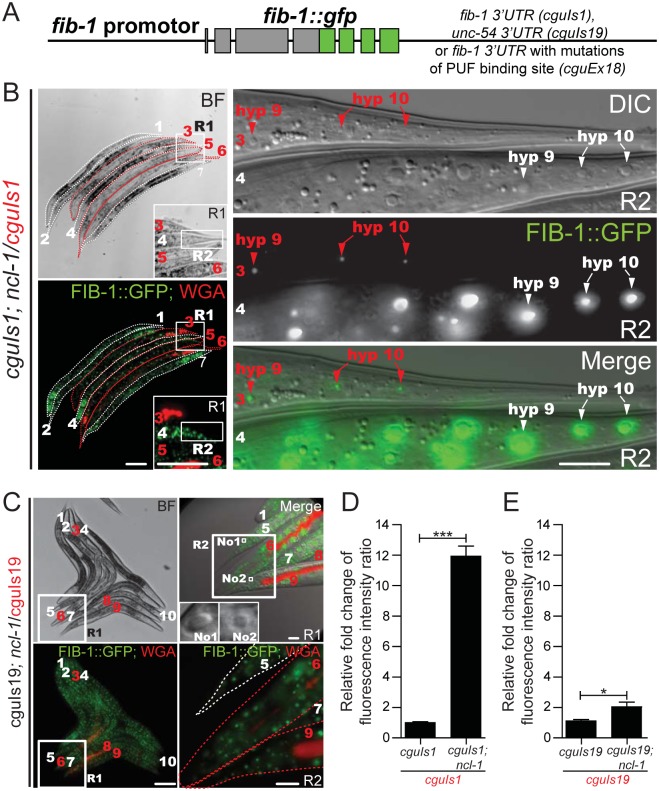
Fig 3. The 3’ UTR of fib-1 is under the control of NCL-1.
(A) Schematic for a FIB-1::GFP transgene construct that harbors 3' UTR sequence from either the fib-1 or unc-54 gene, or with mutated PUF binding site. (B) Before image acquisition, worms of different strains were first labeled with or without WGA 555 prior to mixture at an equal ratio. Expression of the fib-1 3' UTR reporter (FIB-1::GFP) was examined in the N2 (cguIs1; WGA-positive and indicated by numbers and contours in red) and ncl-1 mutant (ncl-1(e1942); cguIs1; WGA-negative and indicated by numbers and contours in white) backgrounds. Insets in the left panels represent enlarged versions of the boxed regions (R1); images on the right denote magnified versions of the boxed regions in the corresponding images on the left (R2), and represent the tail hypodermis. Red and white arrowheads pinpoint the hyp9 and hyp10 cells of respectively the cguIs1 and ncl-1(e1942); cguIs1 worms. Scale bar, 100 μm in images on the left and 10 μm in images on the right. (C) Comparison of FIB-1::GFP expression of a pair of worms carrying a reporter with unc-54 3' UTR (cguIs19 and ncl-1(e1942); cguIs19, respectively WGA-positive and WGA-negative, and indicated by numbers in red and in white). Image on the upper right denotes a magnified version of the boxed region in the corresponding image on the left (R1) and represents the tail region. Insets of upper right panel represent the nucleolus (labeled with No1 and No2) of tail hypodermis from worm 5 and worm 9, respectively. Note the enlargement of nucleolus in ncl-1(e1942); cguIs19 but similar fluorescence intensity as cguIs19 (lower right image, which is an enlarged version of the R2 box region from upper right image). Scale bar: 100 μm (left panels) and 10 μm (right panels). (D)-(E) Quantitative image analysis for FIB-1::GFP reporter expression in the whole worms. Fluorescence in images shown in Fig 3B (the cguIs1 and ncl-1(e1942); cguIs1 worm pair containing a full-length of fib-1 3' UTR) (D), in Fig 3C (the cguIs19 and ncl-1(e1942); cguIs19 worm pair containing the unc-54 3' UTR) (E), were quantitatively determined, with ratios between the indicated strains being shown in the bar graph. Asterisk signifies the difference: *P < 0.05; ***P < 0.001; n = 148–215 animals.

