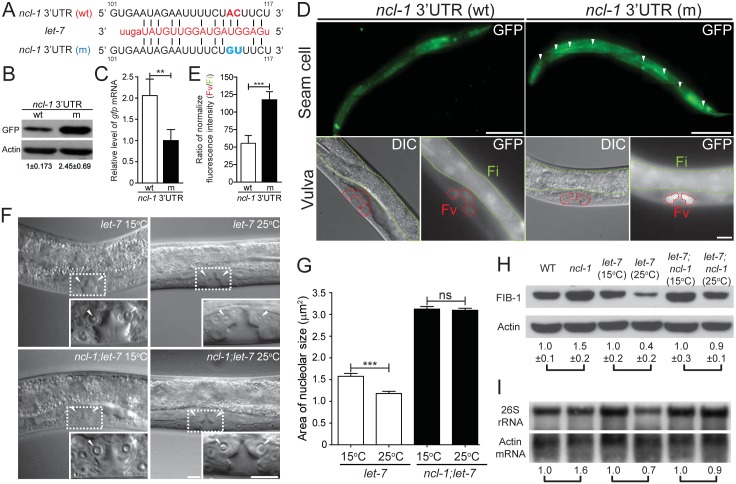
Fig 5. The let-7-ncl-1-fib-1 pathway controls the nucleolus size and function.
(A) Putative miRNA target sites within the ncl-1 3' UTR. The alignment on the right indicates the ncl-1 3' UTR/let-7 complement, with numbers denoting sequences relative to the stop codon. GFP reporter construct (driven by ncl-1 promoter) that contains wild-type 3' UTR sequence (wt) or mutated let-7 target sites (m) was used to generate transgenic worms. (B) Expression of the GFP protein and mRNA expression in worms carrying the reporter gene with wild-type (wt) vs. mutant (m) ncl-1 3' UTR. (A) Immunoblots of GFP reporter and the control Actin in the indicated worms. Numbers below represent relative levels of normalized GFP expression, based on quantified intensity of immunoblotting signals from three independent experiments. (C) Quantitative RT-qPCR analysis of gfp mRNA expression in the indicated transgenic worms. **P < 0.01; n = 4. (D) Characterization of GFP reporter expression in the seam (top; scale bar of 100 μm) and vulva (bottom; scale bar of 10 μm) cells. Arrowheads point to the seam cells, while red and green contours respectively denote the vulva (Fv) and intestinal (Fi) areas in the bottom images. (E) Quantitative depiction of the ratios of average fluorescence intensity in the indicated strains. Ratios were derived from the vulva (Fv) vs. intestinal (Fi) comparison, as shown in (D). ***P < 0.001; n = 46 animals. (F) DIC microscopy of the vulva cells of the let-7(n2853) and let-7(n2853); ncl-1(e1942) worms, at the permissive (15°C) or non-permissive (25°C) temperature. Insets represent enlarged images of the boxed regions in the corresponding figures. Arrowheads point to the nucleoli of the vulva cells. Scale bar, 10 μm. (G) Quantitative representation of the results shown in (F), illustrating the distribution of nucleolar areas in the vulva. Asterisk signifies difference between the indicated strains: ***P < 0.001; ns, no significance; n = 22–36 [for let-7(n2853) worms] or 100–110 [for ncl-1(e1942); let-7(n2853) worms]. (H) Western blot analysis of FIB-1 and Actin (as control) in the indicated strains. Numbers below represent the relative levels of FIB-1 protein expression (normalized to the control sample of each pair-wise comparison), calculated from five independent experiments. (I) Northern blot analysis of 26S rRNA and Actin mRNA expression in the indicated strains of worms as shown in (H). Numbers below represent the relative levels of 26S rRNA, with control sample of each pair-wise comparison being represented as 1.

