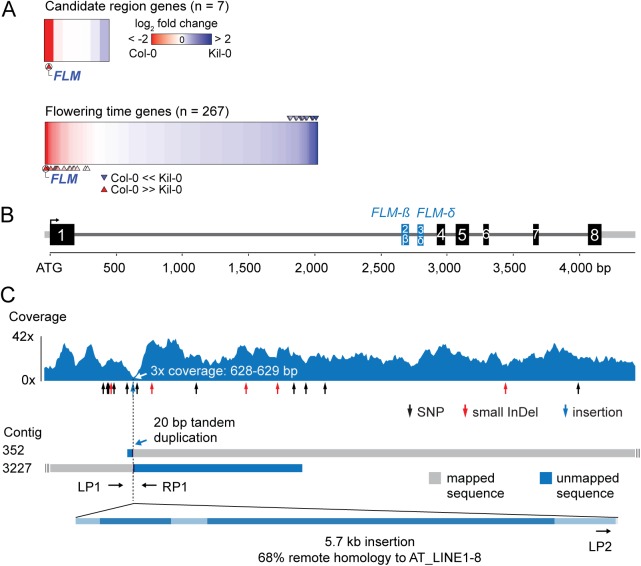
Fig 2. Identification of the Kil-0 early flowering locus.
(A) Heatmap of differentially expressed genes in Kil-0 versus Col-0 in 21°C as analyzed by RNA-seq. The upper panel shows the fold change expression between Kil-0 and Col-0 of the seven expressed genes in the 31.3 kb mapping interval depicted in S2E Fig. The lower panel shows expression values of 267 flowering time genes. Fold changes are log2 transformed, blue represents upregulation and red downregulation in Kil-0 compared to Col-0. Significantly differentially (p < 0.01) expressed genes are marked with arrows. (B) Gene model of the FLM Kil-0 locus of the Col-0 reference gene with the alternatively used exons 2 and 3 that give rise to FLM-ß and FLM-δ are shown in blue. Black boxes indicate exons, grey lines are 5’- or 3’-untranslated regions or introns. (C) Read coverage of the Kil-0 genomic data on the Col-0 reference gene model. Small sequence polymorphisms are indicated below the graph. Distribution of two independently assembled contigs from Kil-0 genomic sequence reads reveal the presence of a 5.7 kb insertion in FLM intron 1 with homology to the A. thaliana transposon At_LINE1-8. Sequence elements with homology to the LINE element are shown in dark blue in the lowermost panel. The respective positions of the primers used for the screening of further A. thaliana accessions are depicted.

