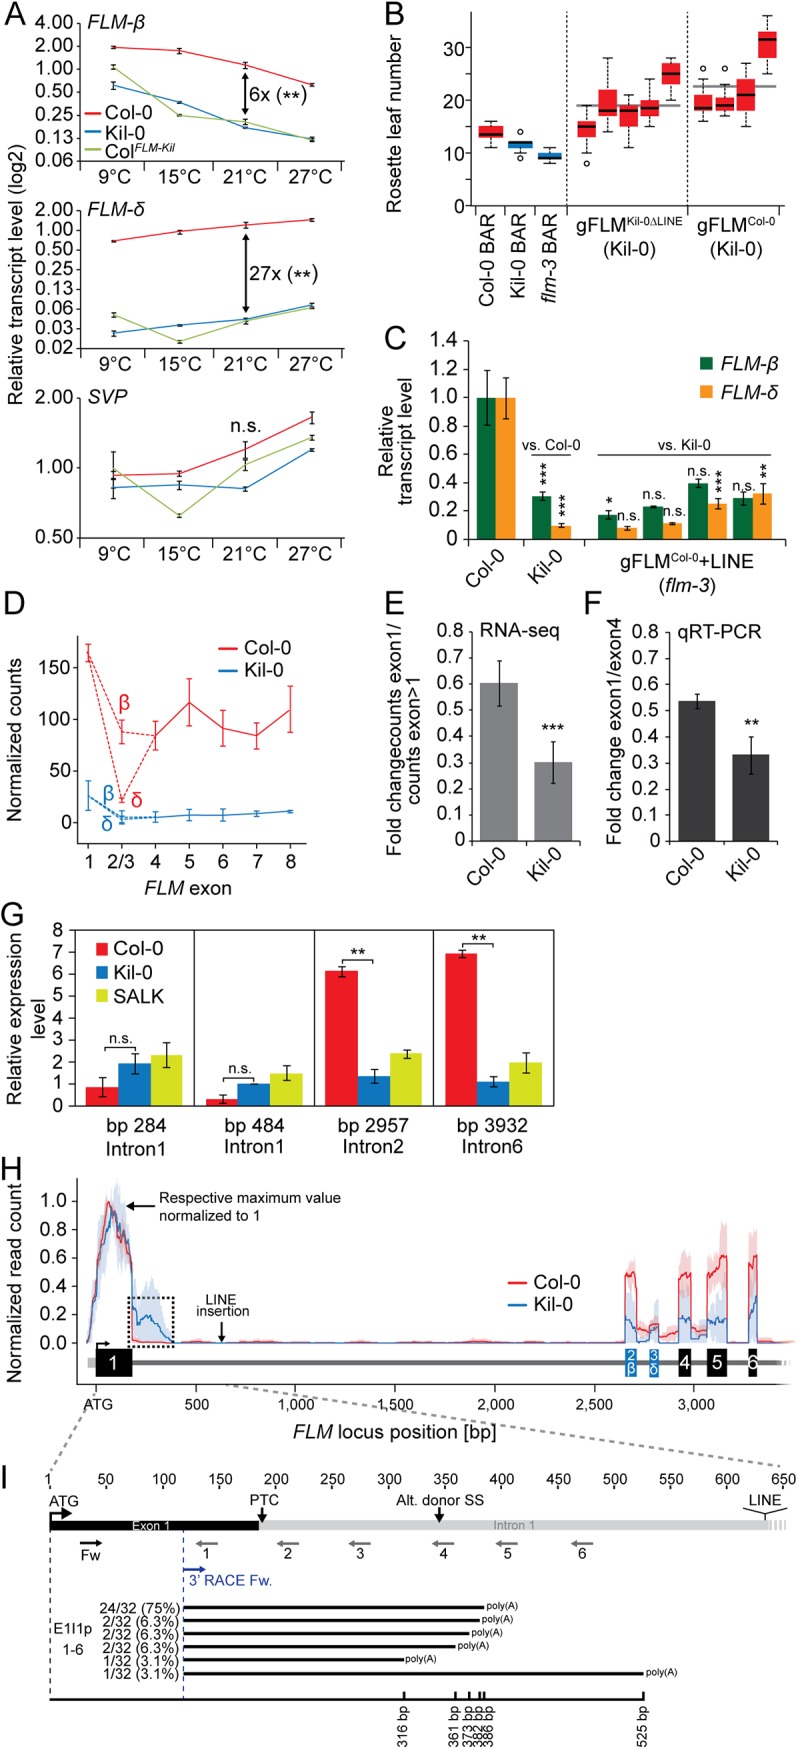
Fig 4. The large insertion in the first intron affects splicing efficiency and gene expression of FLM.

(A) qRT-PCR analysis of FLM-ß, FLM-δ, and SVP expression in ten day-old Col-0, Kil-0, and ColFLM-Kil plants. Seven day-old seedlings grown at 21°C were transferred to the indicated temperature and grown for further three days. The fold change differences between Col-0 and Kil-0 at 21°C are indicated in the graph. Error bars represent SE of three biological replicates. (B) Quantitative flowering time analysis of four—five independent T2 lines in the Kil-0 background that are either hemi- or homozygous for the respective transgene construct. 14–20 transgenic plants grown at 21°C under long day photoperiod were analyzed for each genotype. Transgenic T2 lines expressing the empty pGREEN0229 vector control construct (BAR+) in the Col-0, Kil-0, and flm-3 lines were analyzed for comparison. Outliers were determined based on 1.5 x IQR (interquartile range). (C) qRT-PCR analysis of FLM-ß and FLM-δ expression of four independent homozygous T3 lines of the indicated construct in the flm-3 background. Plants were grown for ten days under 21°C long day photoperiod. Error bars represent SE of three biological replicates. (D) Graph displaying normalized read counts for the seven FLM exons in Col-0 and Kil-0, including the differentially spliced exon 2 that gives rise to the FLM-ß and FLM-δ isoforms. (E) Quantification of the normalized read counts shown in (D). The average ratios and SD from three biological replicates of the read counts of exon 1 compared to the read counts of exon 2 to exon 7 are shown. (F) qRT-PCR-based verification of the RNA-seq result shown in (E) using fragments corresponding to FLM exon 1 and exon 4. The ratios ± SE of the respective expression values are shown from three biological replicates. (G) qRT-PCR quantification of unspliced pre-mRNA from isolated nuclei. Primers are located in FLM introns 1, 2, and 6 and ACT8 introns 2 and 3, respectively. Primer sequences are provided in S7 Table. The position of the respective reverse primer relative to the ATG start codon is indicated. Fold changes are averages ± SE of two biological replicates are indicated. Student’s t-tests: ** = p ≤ 0.01; n.s., not significant. (H) Normalized read counts for FLM as detected by RNA-seq in Col-0 and Kil-0 mapped to the genomic FLM locus from exon 1 through exon 5. For both accessions, the number of mapped RNA-seq reads was normalized to range from 0 (no expression) to 1 (maximum expression). Lines indicate the mean expression level and light blue and light red areas indicate the 5% and 95% confidence intervals that were determined across the biological replicates of one genotype. Exons are represented as boxes, untranslated regions and introns as lines. Note the relative increase in intron 1 reads in Kil-0 as indicated with a dotted line. The position of the LINE insertion in FLM Kil-0 is indicated by an arrow. Student’s t-tests were performed as indicated: * = p ≤ 0.05; ** ≤ 0.01; *** = p ≤ 0.001; n.s., not significant. (I) Schematic representation of the primers used for the qRT-PCR quantification of FLM intron 1 sequence-containing transcripts and the 3’-RACE PCR as indicated by arrows below the gene model; PTC, premature termination codon. A schematic representation of the intron 1 sequence-containing polyadenylated transcripts is indicated in the lower part of the panel. Numbers on the left indicate the frequency of each transcript among the 32 individual sequenced clones. The black line indicates the length of each transcript respective to the ATG start codon.
