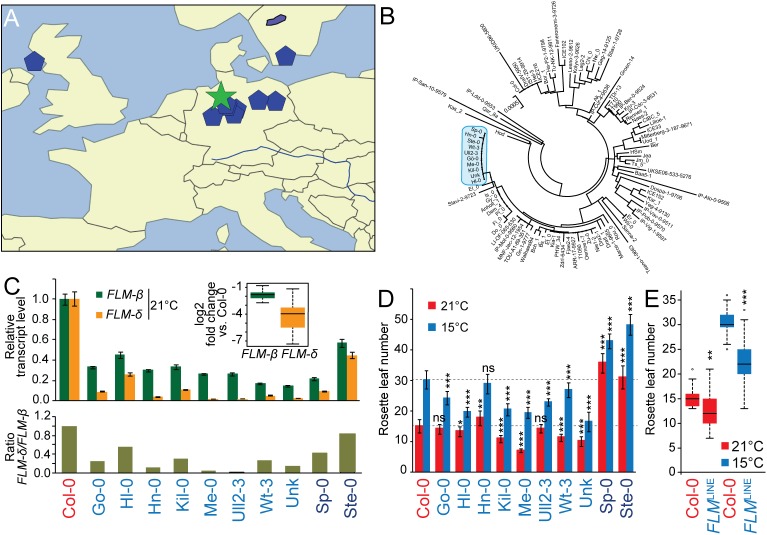
Fig 5. Geographical distribution and molecular analysis of FLM LINE accessions.
(A) Geographical distribution of the FLM LINE accessions (blue pentagons) with the centroid (green star). Please note that one the accession with an ambiguous name was excluded due to the unavailability of geographic information. (B) Neighbour-Joining tree showing the genetic relationship among FLM sequences. The FLM sequences of the 10 FLM LINE accessions were analyzed together with Col-0 and further 88 randomly selected sequences. The clade harboring all FLM LINE alleles is marked in blue; see S8 Fig for a detailed representation of the entire tree. (C) qRT-PCR analyses of FLM-ß and FLM-δ transcript abundance of ten day-old seedlings of all FLM LINE accessions when grown in 21°C long day photoperiod (upper panel). Averages ± SE of three measurements after normalization to Col-0 as a control are shown. The inserted graph shows the summarized log2-transformed fold changes of FLM LINE accessions only (Col-0 excluded). The lower panel displays the ratios of FLM-δ over FLM-ß when normalized to Col-0. (D) Quantitative flowering time analysis of FLM LINE accessions grown at 21°C and 15°C under long day photoperiod. Dashed lines mark the respective values for Col-0. Please note that Sp-0 and Ste-0 are vernalization-sensitive accessions. (E) The right graph shows the summarized rosette leaf number of the eight vernalization-insensitive FLM LINE accessions. Student’s t-tests were performed in comparison to Col-0 unless indicated otherwise: * = p ≤ 0.05; ** ≤ 0.01; *** = p ≤ 0.001; n.s., not significant. El-0 was identified relatively late in this study and not included in this detailed analysis.

