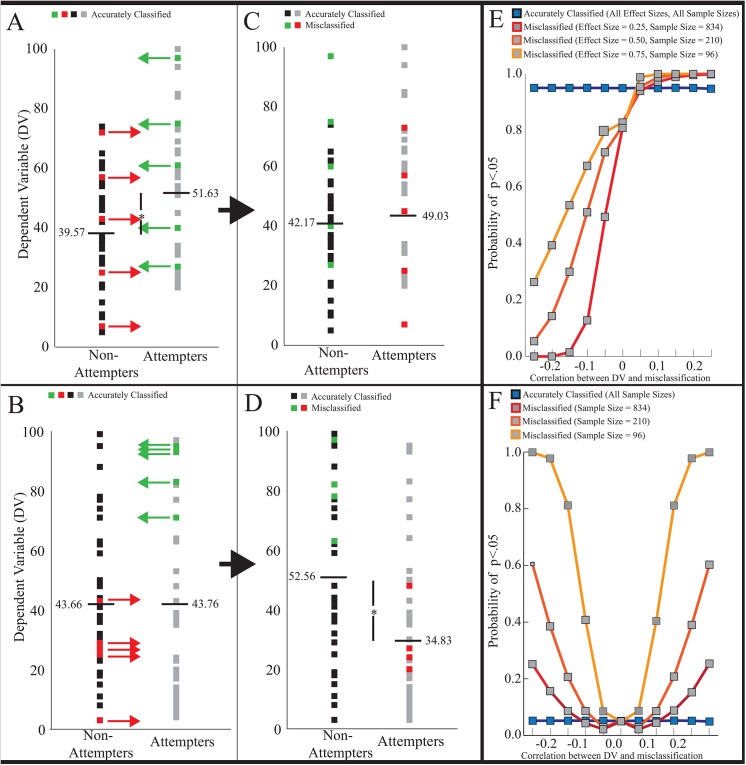
Fig 2. A visual example of DV-misclassification relationships and the results of the statistical simulations.
(A) Model data of a “true effect" (B) Model data of a “true null effect.” The red and green arrows in (A) and (B) represent data points that will be misclassified due to participants inaccurately categorizing their suicidal behavior. (A) and (C) show an example of when the misclassification is random (i.e., dependent variable (DV)-misclassification correlation is zero). Because true attempters tend to be higher on the DV, true attempters randomly misclassified into the non-attempters group will tend to increase the group mean of non-attempters (e.g., from 39.57 in (A) to 42.17 in (C)). Likewise, in the example, true non-attempters tend to be lower on the DV and therefore, true non-attempters randomly misclassified into the attempters group will reduce the group mean of attempters (e.g., from 51.63 (A) to 44.03 in (C)). Thus, when there is a true difference between the groups at the population level, random misclassification will cause the two group means to move closer together reducing the power to detect the true effect. (B) and (D) shows an example of when there is a pattern to the misclassification (the DV-misclassification correlation is approximately r = 0.20). In this example, attempters higher on the DV tend to misclassify their behavior, causing an increase in the mean of non-attempters (e.g., from 43.66 in (B) to 52.56 in (D)). Non-attempters that are lower on the DV tend to misclassify their behavior, causing a decrease in the mean of attempters (e.g., from 43.76 in (B) to 34.83 in (D)). Thus, during a “true null effect” when the DV-misclassification correlation is present, misclassification causes the group means to shift further apart, increasing the probability of finding a false significant difference. (E) The outcome of the statistical simulation for data with a “true effect” across different effect sizes (varying sample sizes to maintain statistical power at 0.95). Without a DV-misclassification correlation, power to detect the true effect is reduced by approximately 15% across all effect sizes. Power decreases as the DV-misclassification correlation strengthens in the opposite direction of the true effect, increasing the chance of a false negative result (i.e., Type II error). This reduction in power is greater when the effect size is small and the sample size is large compared to when there are larger effect sizes and smaller sample sizes. (F) The “true null effect” across the same sample sizes as in the true effect simulation (alpha = 0.05). When misclassification is random for a “true null effect,” it does not affect the false positive error rate. As the DV-misclassification correlation strengthens in either direction, chances of a false positive increase (i.e., Type I error). Compared to larger sample sizes, chance of a false positive is greatest when there is a smaller sample size.

