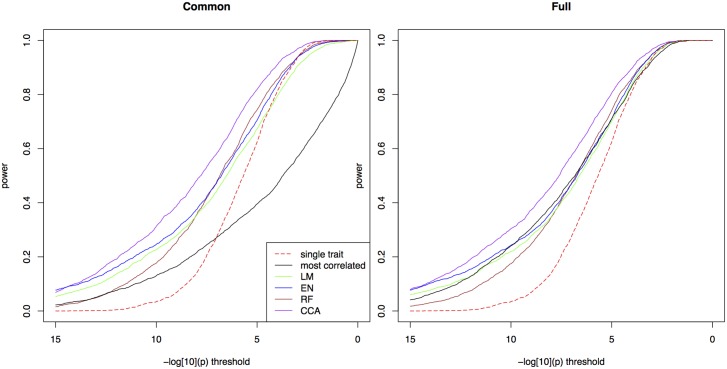
Fig 1. Power in simulations.
The proportion of simulated traits for which the -log10(p) value of the causal SNP is above the threshold, for single trait mapping (red), bivariate ETM with the most correlated environmental variable (black), and bivariate ETM with 4 different prediction methods (LM, EN, RF, CCA; respectively green, blue, brown and purple). Bivariate ETM was performed by testing for a common marker effect (left) and by testing whether there is any effect on environment or trait (right). The causal SNP explained 5% of the variance of the simulated trait, while polygenic background and residual variance explained respectively 45% and 50%.

