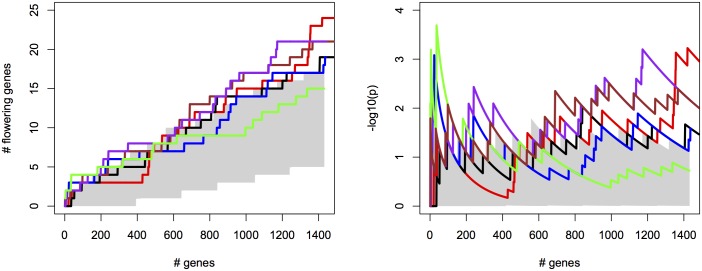
Fig 5. Univariate ETM for flowering time in A. thaliana, for different prediction methods, compared to univariate mapping of summer day length and latitude.
Left panel: number of known flowering genes recovered, as a function of total number of genes considered. Right panel: corresponding enrichment probabilities (-log10(p)). Enrichment is defined as the probability of recovering k out of m genes by chance, under the hypergeometric distribution. Colors represent ETM with CCA prediction (purple), ETM with LM (green), ETM with RF (brown), ETM with EN (blue), univariate mapping of latitude (black), univariate mapping of summer day length (red). Recovery and enrichment based on randomly sampled SNPs are shown as reference (grey dashed line). The area in gray marks the 5% upper and lower percentiles based on 200 permutations of the univariate/bivariate traits.

