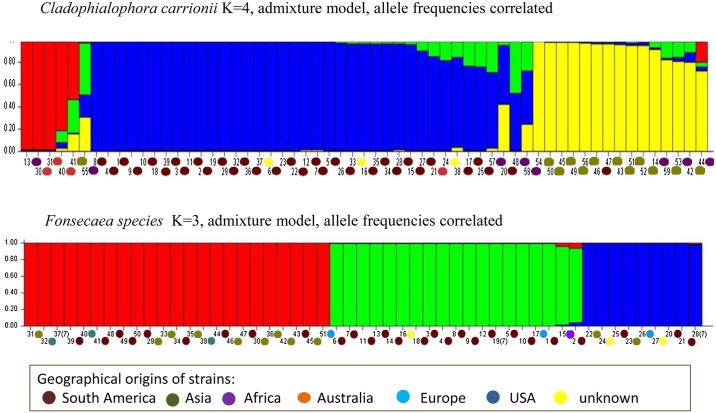
Fig 3. The population structure of Cladophialophora carrionii and Fonsecaea spp. with Q-hat order.
Structure 2.3.4 used to establish the population structure of global isolates of C. carrionii isolates and Fonsecaea spp., Cladophialophora carrionii K = 4, admixture model, allele frequencies correlated; Fonsecaea species K = 3, admixture model, allele frequencies correlated. In the Structure display the color between parentheses depict the geographical origin of the haplotype group.

