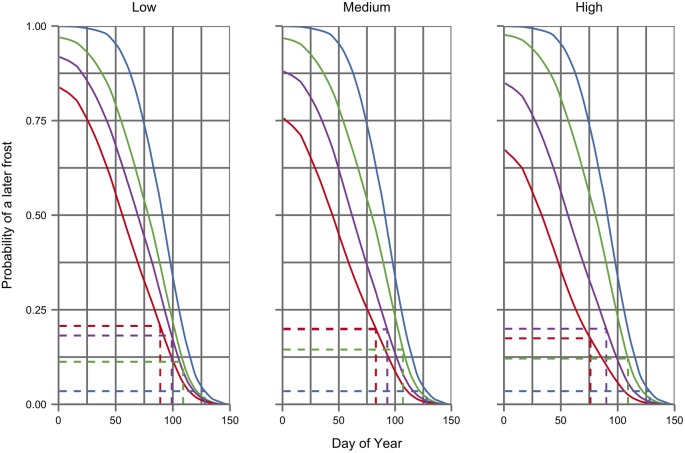
Fig 4. Spring frost risk profiles under baseline (blue) and three future time periods (green 2010–39, purple 2040–69, red 2070–89) for low, medium and high emissions scenarios (from left to right).
Dotted lines indicate the mean budbreak date, calculated using a spring warming model [58], and the corresponding risk of a later frost under each scenario and time period.

