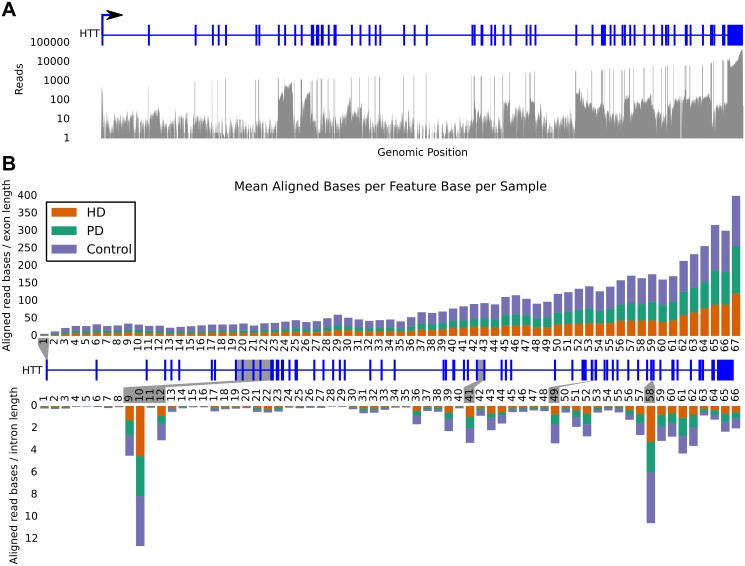
Fig 1.
A) Read pileup of the superset reads showing coverage in exons and specific introns. Canonical HTT gene model is in blue. B) Relative contribution of reads from each disease dataset to the superset binned into exon (top) and intron (bottom) features. Each bar is the average number of covered bases per base position in the given feature divided by the number of samples in the corresponding condition. The canonical gene model lies between the bar charts. High intronic coverage is apparent in introns 9, 10, 12, 41, 49, and 58, highlighted in grey. None of the features are obviously biased toward any of the conditions. The rightward skew of counts is indicative of the poly-A selection method used in library prep.

