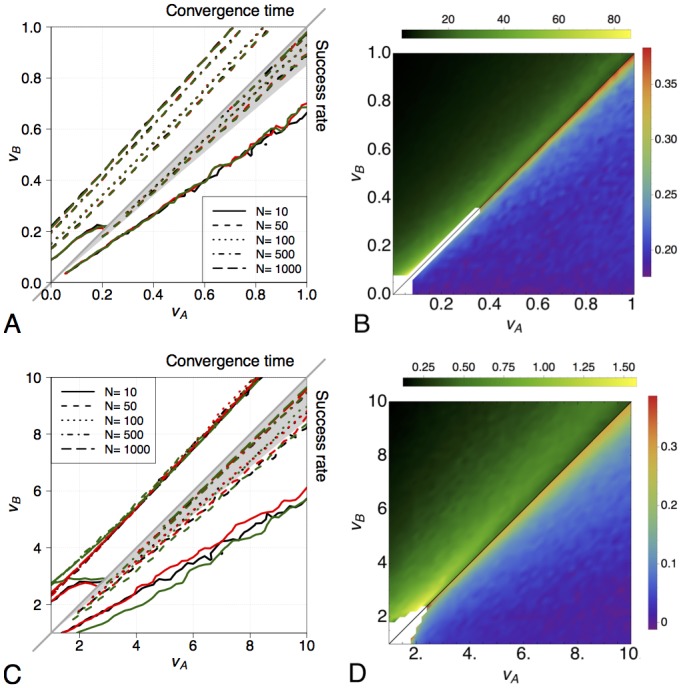
Fig 2. Collective decisions on a fully-connected network: comparison between the micro and the macro dynamics and scaling properties.

(A,C) Comparison between the stochastic finite-size macroscopic model (black lines) and the multiagent implementation with both the homogeneous strategy (red lines) and the heterogenous strategy (green lines). Results are displayed for varying system size N. For each possible configuration (v A, v B), 500 independent runs are performed. We show results for configurations with effectivity . The plot is divided in two parts: in the bottom-right triangle, we consider the success rate for each configuration (v A, v B), where v A ≥ v B. For each group size N, we show the isolines at . The gray triangle indicates quality value pairs below the target resolution R = 0.15 (i.e., configurations in which the two options are considered equivalent). In the top-left half of the plot, we consider the convergence time for each configuration (v A, v B), where v B ≥ v A (i.e., the symmetric problems with respect to the bottom-right plot). For each group size N, we show the isolines at . (B, D) Scaling of the convergence time with the system size N. For each configuration (v A, v B), we fit the curve and we show the heat-map for the fitted coefficient a (see the bottom-right triangle showing the coefficient value for each configuration (v A, v B), v A ≥ v B) and b (see the top-left triangle showing the coefficient value for symmetric configurations (v A, v B), v B ≥ v A) across the decision space. Also in this case we show only configurations where for all N, and the white space indicates configurations with low effectivity. (A,B) Results for case-study 1A with v i ∈ [0, 1], γ i = 0.6v i, α i = 0, ρ i = 0.1v i, σ i = 1 and i ∈ {A, B}, . (C,D) Results for case-study 1B with v i ∈ [1, 10], γ i = ρ i = v i, α i = 1/v i, σ i = 10 and i ∈ {A, B}, .
