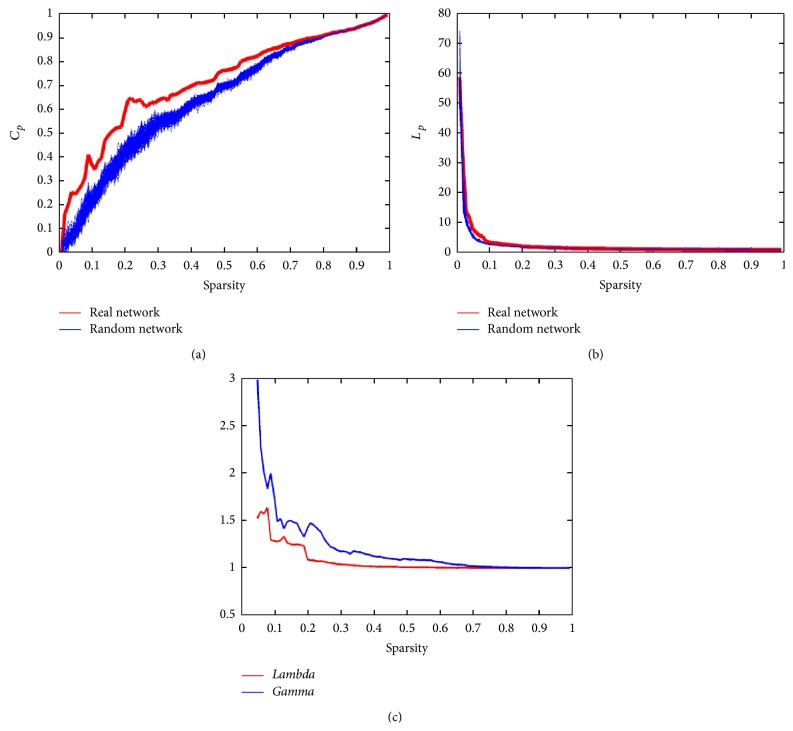
Figure 9.
The results of the network analysis. (a) C p is the clustering coefficient; the red line is the C p of the real network, and the blue lines are the C p of the random network. (b) L p is the characteristic path length; the red line is the L p of the real network, and the blue lines are the L p of the random network. (c) Lambda is the normalized clustering coefficient, which is plotted with a red line; Gamma is the normalized characteristic path length, which is plotted with a blue line.

