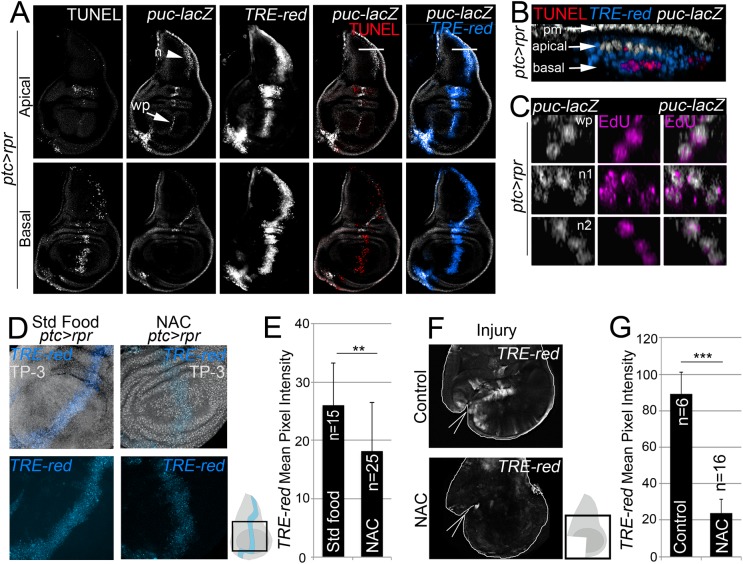
Fig 3. ROS control JNK activity.
(A) Test of JNK reporters. All images in A correspond to the same disc after ptc>rpr induction. Top row: apical sections. Bottom row: basal sections. Note that puc is more abundant in apical than basal sections, particularly in the notum (n; arrowhead) and wing pouch (wp; arrow). Cell death (TUNEL) and high TRE-red are more abundant in basal sections. (B) Zoom of a digital cross section of the zone marked with a white line in A. Endogenous puc-lacZ is found in the outer layer of peripodial membrane cells (pm). Puc-lacZ cells in the disc columnar epithelium are apical (white), most apoptotic cells are basal (red), and TRE-red positive cells are apical and basal (blue). (C) Three digital cross section in an apical puc-lacZ zone of the wing pouch (wp) and notum (n1, n2). Each example contains three to four cells with co-localization of ß-galactosidase and EdU. (D) TRE-red reporter in ptc>rpr discs of larvae fed with standard food or NAC-supplemented food (NAC). TP-3: TO-PRO-3. (E) Mean pixel intensities of TRE-red reporter in ptc>rpr discs with standard or NAC food. The pixel intensity for standard food was 26.06 ± 7.22 (S.D.; n = 15) and for NAC 18.12 ± 8.32 (S.D.; n = 25). (F) TRE-red reporter expression in physically injured discs, cultured for 7 h ex vivo in Schneider’s culture medium with or without NAC. Outline: disc contour. Wedges: cut. (G) Mean pixel intensities of TRE-red reporter in ex vivo cultured discs with or without NAC. The pixel intensity for standard culture was 88.98 ± 22.25 (S.D.; n = 6) and for NAC 23.98 ± 10.26 (S.D.; n = 16). **P<0.01, ***P<0.001.

