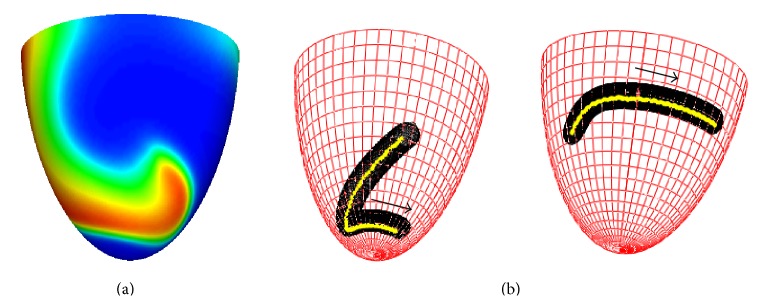
Figure 4.

Drift of a scroll wave in a model of human ventricles represented by trajectories of filament on a midmyocardial surface. (a) Initial position of a scroll wave at the midmyocardial surface. Different colors represent different values of the transmembrane voltage (variable u) with the red color corresponding to u = 1 and the blue color corresponding to u = 0. (b) instantaneous (black) and averaged (yellow) filament positions. The arrows show the drift direction. The left panel shows the drift for the geometry with an apical thickness of h = 6 mm; the right panel shows the same for h = 18 mm. Simulations for the normal LV shape (ϵ = 0.85), with anisotropy D a = 4 and high excitability (a = 0.03).
