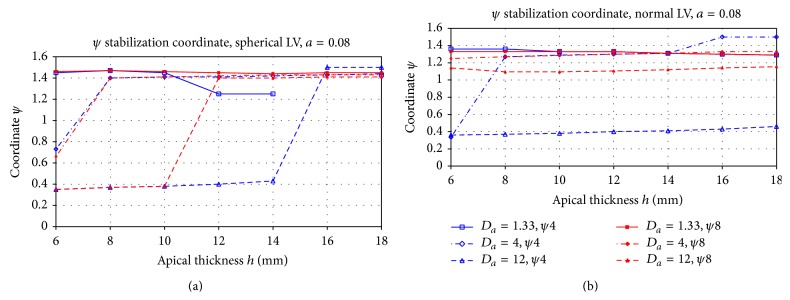
Figure 7.

Final position ψ ∗ of the filament for the spherical LV shape (a) and normal LV shape (b) in the case of negative filament tension (a = 0.08). The blue line shows the results of simulations for initial scroll location at the centre of the LV and the red line for the initial location close to the apex. The X-axis shows the apical thickness h, and the Y-axis is the ψ coordinate. The LV base has ψ = 0, and the apex has ψ = π/2. The different line styles correspond to different anisotropy ratios.
