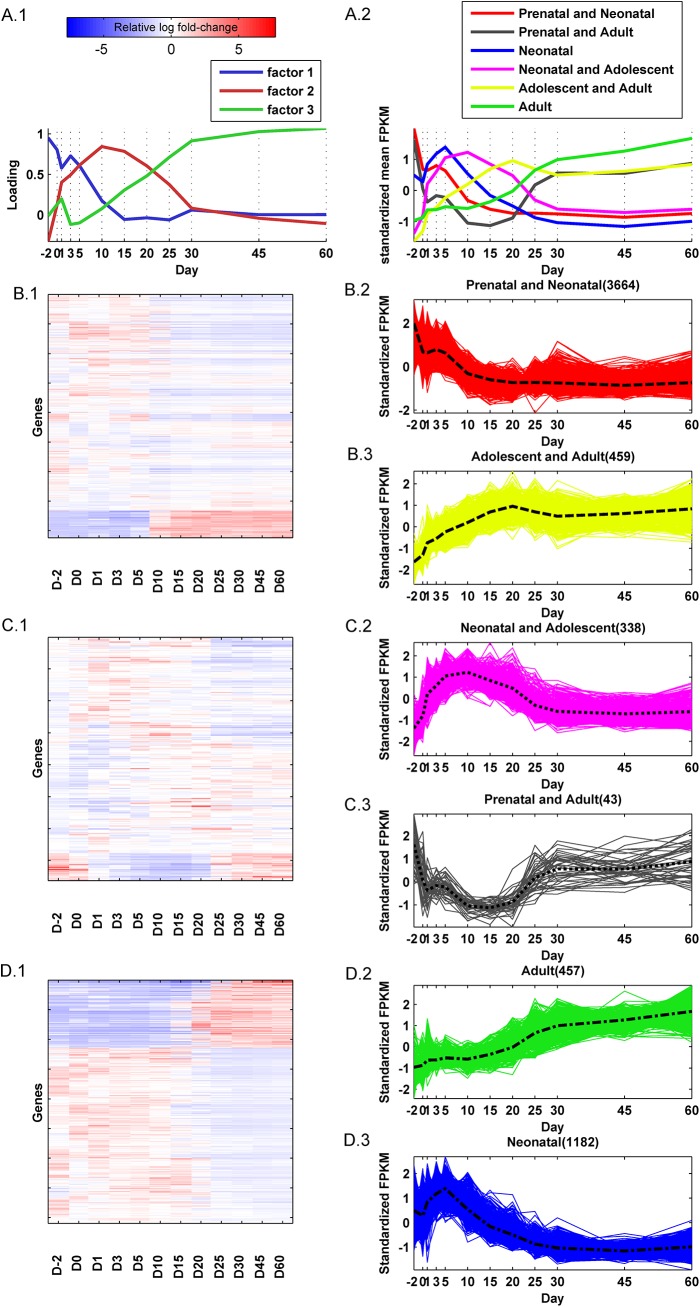
Fig 4. Fundamental gene expression patterns in mouse liver development.
(A.1) Plot of the factor loadings from the exploratory factor analysis of the significantly differentially expressed genes at the 12 ages. Higher loadings indicate days with gene expression that is highly correlated with the factor. The patterns of the factor loading graphs describe the relative contribution of the factors to the observed gene expression over time. (A.2) The average temporal expression patterns of genes in the six clusters. (B.1) Expression heatmap of hierarchically clustered genes correlating with factor 1. (B.2) Standardized (zero mean and unit variance) gene expression pattern of genes positively correlated with factor 1. (B.3) Standardized gene expression pattern of the genes negatively correlated with factor 1. (C.1) Expression heatmap of hierarchically clustered genes correlating with factor 2. (C.2) Standardized (zero mean and unit variance) gene expression pattern of genes positively correlated with factor 2. (C.3) Standardized gene expression pattern of the genes negatively correlated with factor 2. (D.1) Expression heatmap of hierarchically clustered genes correlating with factor 3. (D.2) Standardized (zero mean and unit variance) gene expression pattern of genes positively correlated with factor 3. (D.3) Standardized gene expression pattern of the genes negatively correlated with factor 3. The perforated lines plot average expression. The color-bar represents the relative log fold-change of genes relative to the average expression over the 12 ages.

