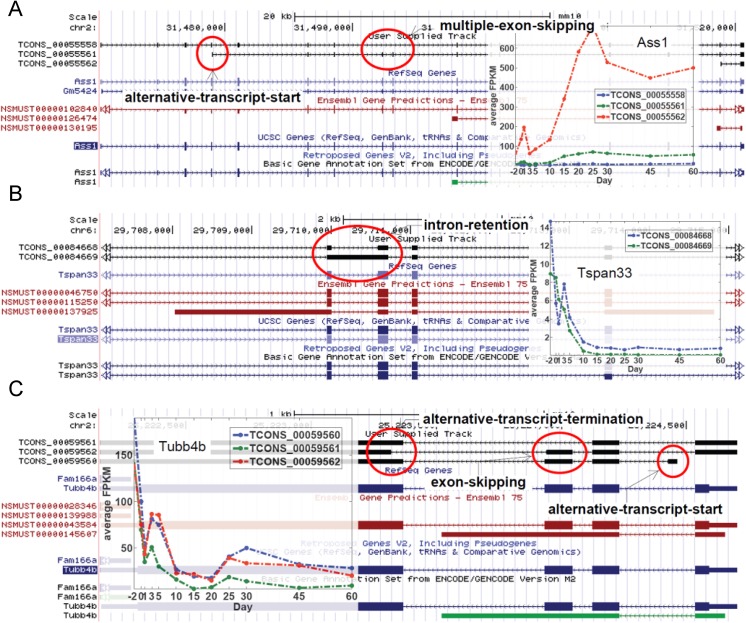
Fig 9. Examples of the different novel isoform variants.
(A-C) Examples of novel isoforms from the selected genes. The novel isoform track is the first track on top in black. This is followed by the RefSeq Genes track (light blue), the Ensembl Genes track (red) and UCSC Genes track (dark blue). The expression pattern of the novel isoforms over the 12 ages is shown in the embedded graphs. The different features constituting the novel isoforms are highlighted by red circles and labeled as appropriate. Exons are shown as boxes. Arrows indicate the direction of transcription.

