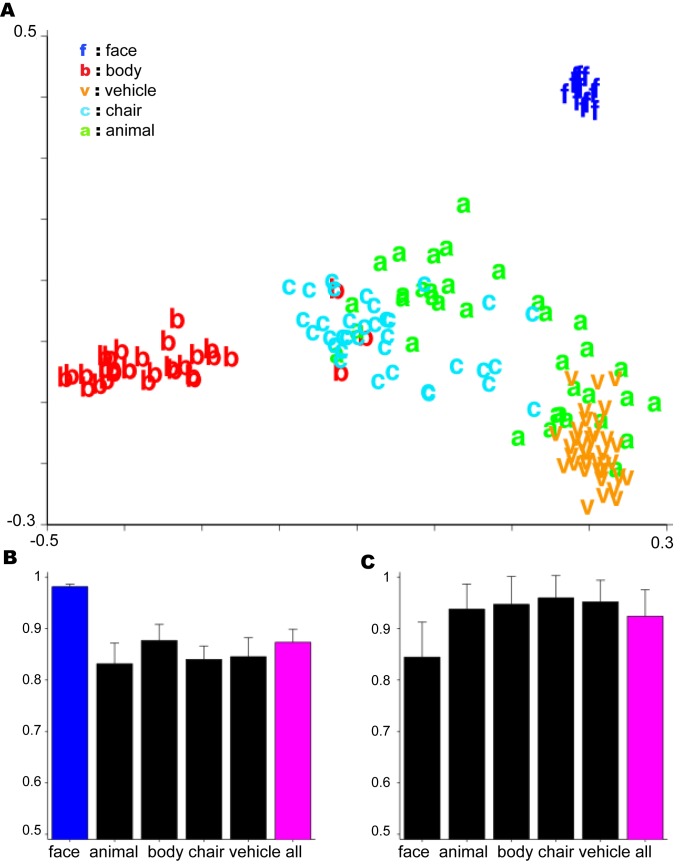
Fig 5. Simulation of the development of domain-specific regions.
In this case the distribution of objects was biased against faces (faces were only 16 of the 156 objects in this simulation). Depth-rotation is the only transformation used here. The main assumption is that the distance along cortex between two HW-modules for two different templates is proportional to how similarly the two templates transform. See S8, S9, and S10 Figs for results of the analogous simulations using different object distributions A. Multidimensional scaling plot based on pairwise transformation compatibility ψ. B. Results on a test of view-invariant face verification (same-different matching). Each bar corresponds to a different cluster produced by an iterative clustering algorithm based on which models visual development—see supplementary methods. The labels on the abscissa correspond to the dominant category in the cluster. C. Basic-level categorization results: Cars versus airplanes. Error bars were obtained by repeating the experiment 5 times, presenting the objects in a different random order during development and randomly choosing different objects for the test set.

