Figure 2.

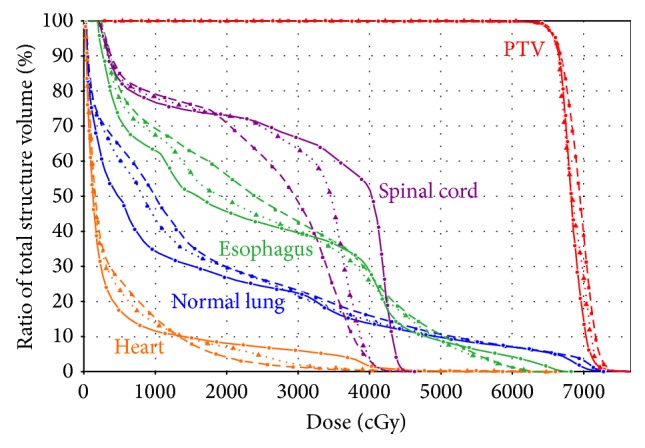
Representative dose volume histogram for IMRT, VMAT, and Hybrid IMRT/VMAT. The curves of IMRT, VMAT, and Hybrid IMRT/VMAT are indicated in solid lines, dashed lines, and dotted lines, respectively.

Representative dose volume histogram for IMRT, VMAT, and Hybrid IMRT/VMAT. The curves of IMRT, VMAT, and Hybrid IMRT/VMAT are indicated in solid lines, dashed lines, and dotted lines, respectively.