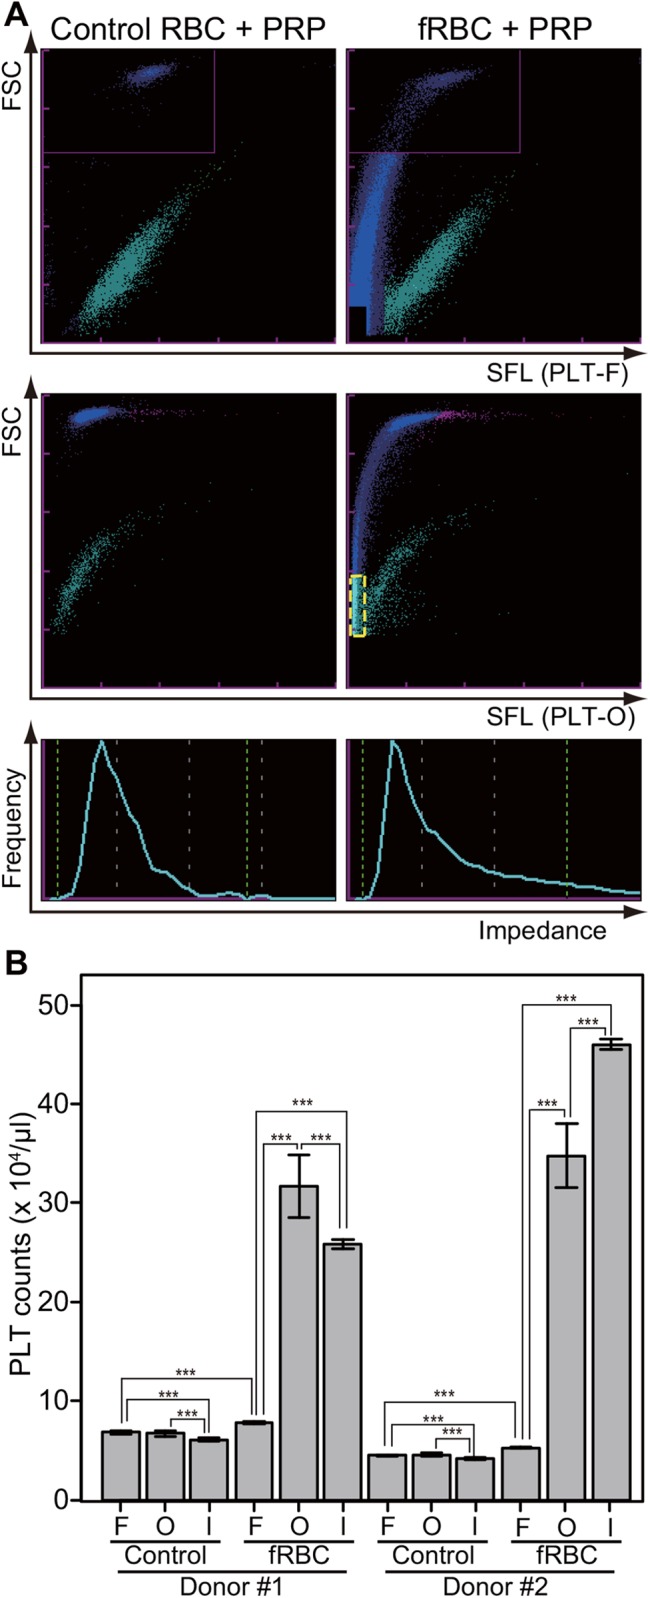
Fig 3. Comparison among three platelet counting methods using a fragmented RBC-PRP mixture.

Three platelet counting methods (PLT-F, PLT-O, and PLT-I) were compared using a control or fragmented RBC (fRBC) and platelet rich plasma (PRP) mixture. The mixtures were made from two donors’ blood and examined ten times per sample. (A) Typical scattergrams from the three methods. Top: PLT-F, middle: PLT-O, bottom: PLT-I. Left: control RBC and PRP mixture, right: fRBC and PRP mixture. The pale blue dots surrounded by yellow dashed line indicate fRBCs misidentified as platelets. (B) Platelet count of the mixtures. Data are expressed as mean ± standard deviation of the mean. F: PLT-F, O: PLT-O, I: PLT-I. Control: control RBC and PRP mixture, fRBC: fragmented RBC and PRP mixture. Significant code *** means p < 0.001.
