
Fig 2. Flexibility landscapes of the thrombin binding site in comparison with cleavage entropy.
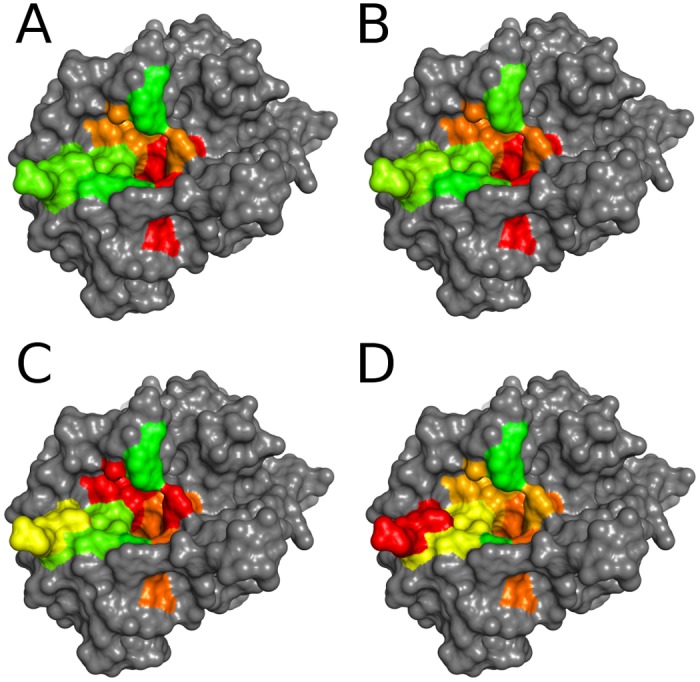
Cleavage entropy mapped to thrombin sub-pockets (A) with colors ranging from red (specific) to green (unspecific) in comparison with sub-pocket average global backbone B-factors (B), φ entropy (C) and ψ entropy (D) with colors ranging from red (rigid or low dihedral entropy, respectively) to green (flexible or high dihedral entropy, respectively). Flexibility metrics in (B) and (C) show good correlation with (A). In contrast to other flexibility metrics, the S6 sub-pocket appears rigid according to ψ entropy (D). See Figure A in S1 File for a mapping based on ranks rather than absolute values.