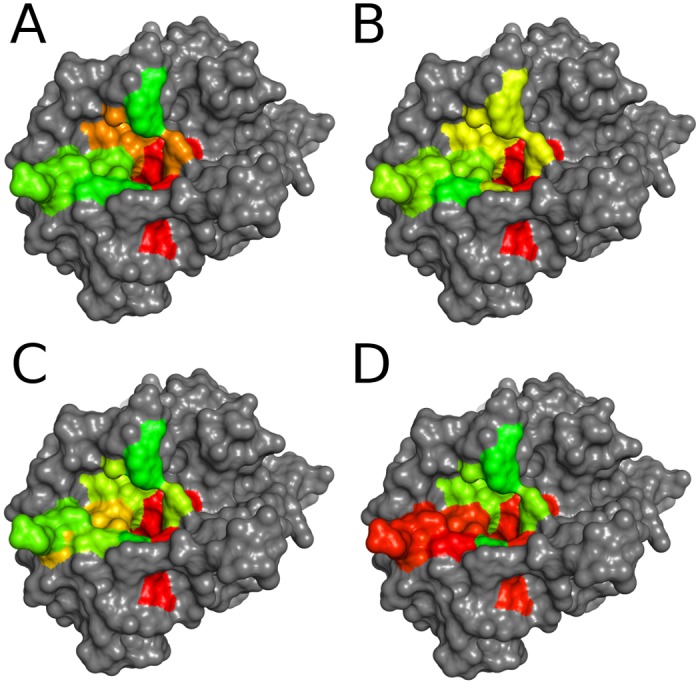
Fig 3. Water thermodynamics within the thrombin binding site in comparison with cleavage entropy.

Cleavage entropy mapped to thrombin sub-pockets (A) with colors ranging from red (specific) to green (unspecific) in comparison with sub-pocket average translational entropy of water (B), orientational entropy of water (C) and solute-water enthalpic interactions (D) with colors ranging from red (high ordering and strong interactions) to green (low ordering and weak interactions). (B) and (C) show strong correlation with binding specificity (A), whereas enthalpic interactions with water are not as predictive (D). See Figure B in S1 File for a mapping based on ranks rather than absolute values.
