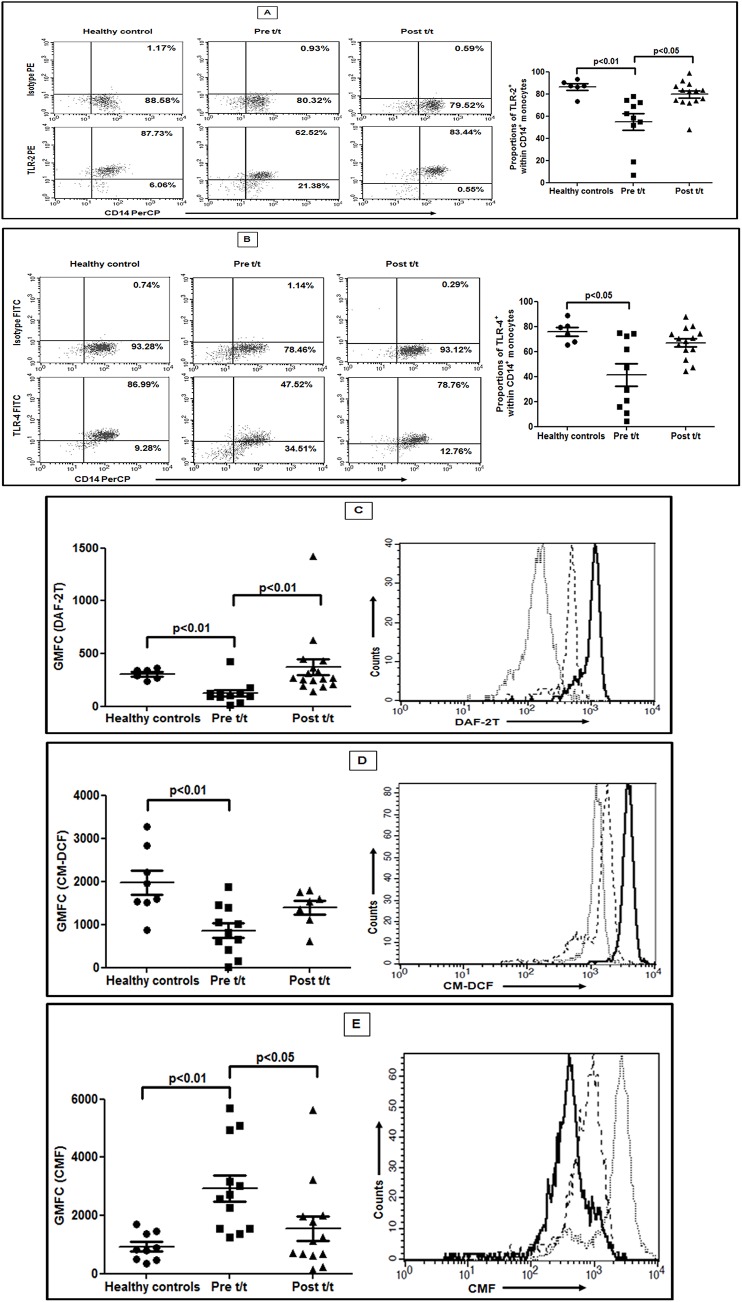
Fig 2. Decreased expression of TLR-2 and -4 and altered redox status within monocytes.
A-B: Representative data showing expression of TLR-2 (A) and TLR-4 (B), within CD14+ monocytes in a healthy control, a patient with PKDL (Pre t/t) and post treatment (Post t/t). Isotype control staining is also shown. *Scatter plots showing frequency of CD14+ monocytes expressing TLR-2 or TLR-4 in healthy controls (●), patients with PKDL (Pre t/t, ■) and post treatment (Post t/t, ▲). *The proportion of CD14+TLR-2+ and CD14+TLR-4+ monocytes was calculated by dividing the percentages of upper right quadrant with the sum of upper and lower right quadrant. C: Scatter plots showing intracellular NO in circulating monocytes of healthy controls (●), patients with PKDL (Pre t/t, ■) and post treatment (Post t/t, ▲). Representative histogram overlay showing DAF-2T fluorescence in monocytes from a healthy control (—), patient with PKDL (…) and on completion of treatment (—-). D: Scatter plots of intramonocytic generation of ROS as for C above. A representative histogram overlay showing CM-DCF fluorescence, as for D above. E: Scatter plots indicating levels of intracellular non-protein thiols as for C above. A representative histogram overlay showing CMF fluorescence as for D above. For analysis, monocytes were initially gated on their forward vs. side scatter characteristics followed by fluorescence of CD14.

