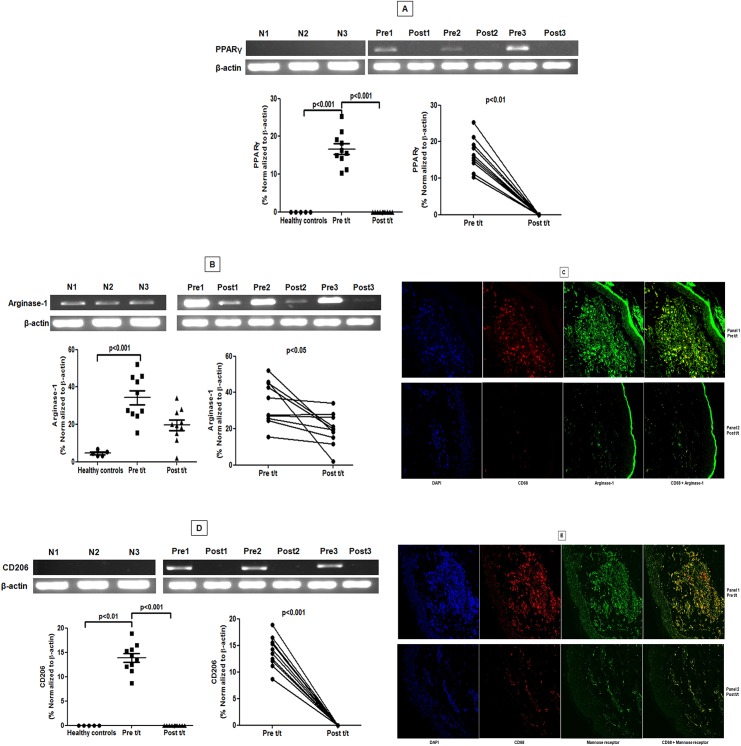
Fig 5. Lesional macrophages showed a raised expression of PPAR-γ, arginase-1 and mannose receptor.
A and B: Representative mRNA expression profile of PPARG (A) and ARG1 (B) in skin samples from healthy controls (N 1–3), patients with PKDL pre (Pre 1–3) and post treatment (Post 1–3). Scatter plots indicate RT-PCR products in healthy controls (●), patients with PKDL (Pre t/t, ■) and after treatment (Post t/t, ▲). These RT-PCR products were quantified by densitometric analysis after normalization with β-actin, along with before and after plots of the same. C: Expression of arginase-1 (green, Panels 1 and 2) in CD68+ macrophages (red, Panels 1 and 2) at the lesional site of a patient with PKDL (Pre t/t) and post treatment (Post t/t). Nuclei are shown in blue (DAPI, Panels 1 and 2). Co-localization of macrophage and arginase-1 appears as yellow. Figures were captured in 400X magnification. D: Representative mRNA expression profile of CD206 in dermal lesions of healthy controls (N 1–3), patients with PKDL pre (Pre 1–3) and post (Post 1–3) treatment. Scatter plots are as in A-B, above. E: Expression of mannose receptor (CD206, green, Panels 1 and 2) in CD68+ macrophages (red, Panels 1 and 2) at the lesional site of a patient with PKDL (Pre t/t) and post treatment (Post t/t). Nuclei are shown in blue (DAPI, Panels 1 and 2). Co-localization of CD68+ macrophages and mannose receptor (CD206) appears as yellow.

