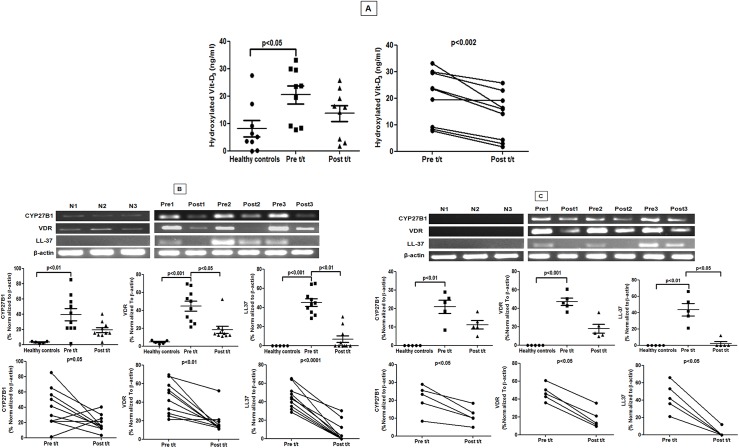
Fig 6. Status of Vitamin D3 and associated downstream signalling molecules in PKDL.
A: Plasma levels of hydroxylated vitamin D3 in healthy controls (●) and patients with PKDL pre (Pre t/t, ■) and post treatment (Post t/t, ▲) along with before and after plots of the same. B: Representative mRNA expression profile of CYP27B1, VDR, LL-37 mRNA in circulating monocytes of healthy controls (N1-3), patients with PKDL (Pre1-3) and post treatment (Post1-3). Scatter plots indicate RT-PCR products in healthy controls (●), patients with PKDL (Pre t/t, ■) and after treatment (Post t/t, ▲). These RT-PCR products were quantified by densitometric analysis after normalization with β-actin, along with before and after plots of the same. C: Representative mRNA expression of CYP27B1, VDR, LL-37 in skin samples from healthy controls (N 1–3), patients with PKDL (Pre 1–3) and post treatment (Post 1–3). Scatter plot indicates expression as in B above.

