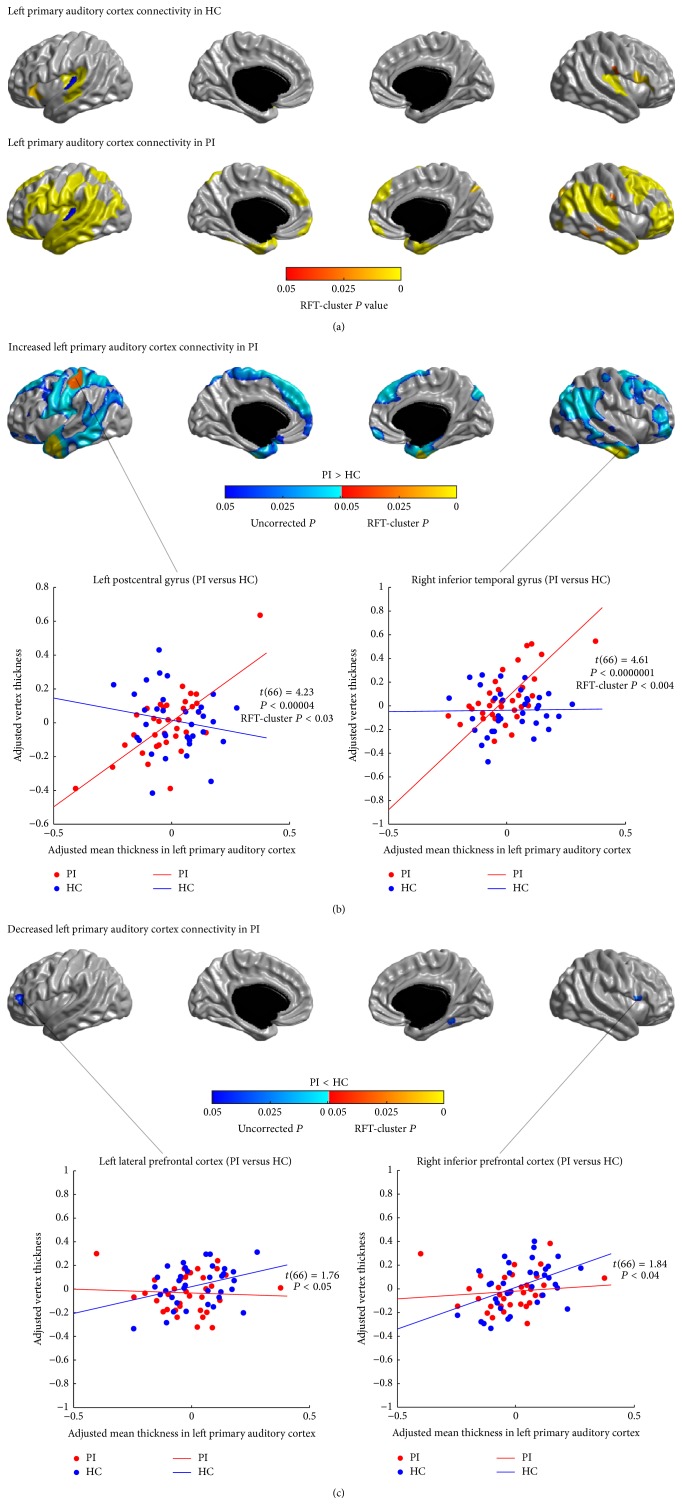
Figure 4.
Between-group comparison of structural covariance seeded from the left primary auditory cortex (PAC). (a) Structural covariance maps in healthy controls (HC) and patients with primary insomnia (PI). Seed region is colored in blue. (b) Increased left PAC-cortical network covariance in PI. Patients showed significantly increased correlations of the left PAC with the left postcentral gyrus and the bilateral anterior LTC (P < 0.05, RFT-cluster corrected), as well as trends of increased correlations with the dorsal and inferior lateral PFC, the bilateral precentral gyri, the right postcentral gyrus, the LTC, the left posterior insula, the lateral parietal cortex, the medial motor areas (PCL/SMA), the dmPFC, the left OLF, the right vmPFC, and the right superior cuneus (P < 0.05, uncorrected). (c) Decreased left PAC-cortical network covariance in PI. Patients showed trends of decreased correlations of the left PAC with the left lateral PFC, the right IFGoperc, and the right FFG (P < 0.05, uncorrected). Scatter plots illustrate slope differences in selected vertices, where adjusted cortical thickness values and regression lines are shown in red for patients and in blue for controls.

