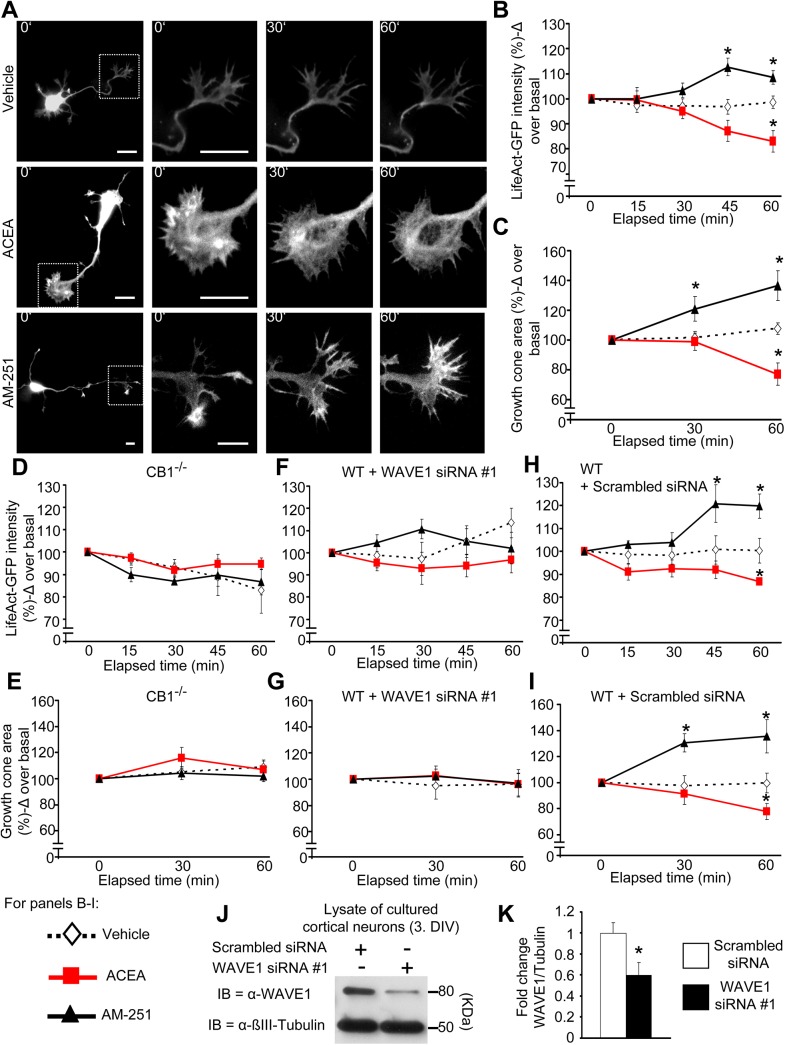
Fig 4. Visualization of cannabinoidergic modulation of actin dynamics in neuronal growth cones mediated by CB1 and WAVE1.
(A) Real time images of wild-type developing cortical neurons transfected to express LifeAct-GFP, a biosensor for levels of F-actin prior to and at different time points following treatment with ACEA (100 nM), AM251 (600 nM), or vehicle. Scale bar represents 10 μm. (B, C) Analysis on the F-actin dynamics based on cannabinoid-induced changes in LifeAct-GFP intensity (B) and area (C) over time in growth cones of cultured cortical neurons derived from wild-type mice (n = 15–17 neurons per group from 5 independent culture experiments). (D, E) However, no changes in LifeAct intensity (D) nor area of the growth cones (E) were observed with cultured cortical neurons derived from CB1-/- mice (n = at least 4 neurons per group from 2 independent culture experiments) after treatment. (F, G) Similarly, cultured cortical neurons with down-regulated WAVE1 showed no changes in LifeAct intensity (F) or area of growth cones (G) after cannabinoid treatment (n = at least 4 neurons per group). (H, I) Moreover, the abrogation of the effects after cannabinoid treatment can be contributed to the down-regulation state of WAVE1, since cultured cortical neurons nucleofected with scrambled siRNA, in turn show changes in LifeAct intensity (H) and area (I) of the growth cone following cannabinoid treatment (n = at least 4 neurons per group). (J, K) Immunoblot representation of WAVE1 down-regulation upon siRNA delivery in developing cortical neurons (J) and the corresponding quantification (K) (n = 6). All graphs represent mean values ± SEM *p < 0.05, two-way ANOVA (B-I) or one-way ANOVA (K) for random measures followed by posthoc Tukey’s test.

