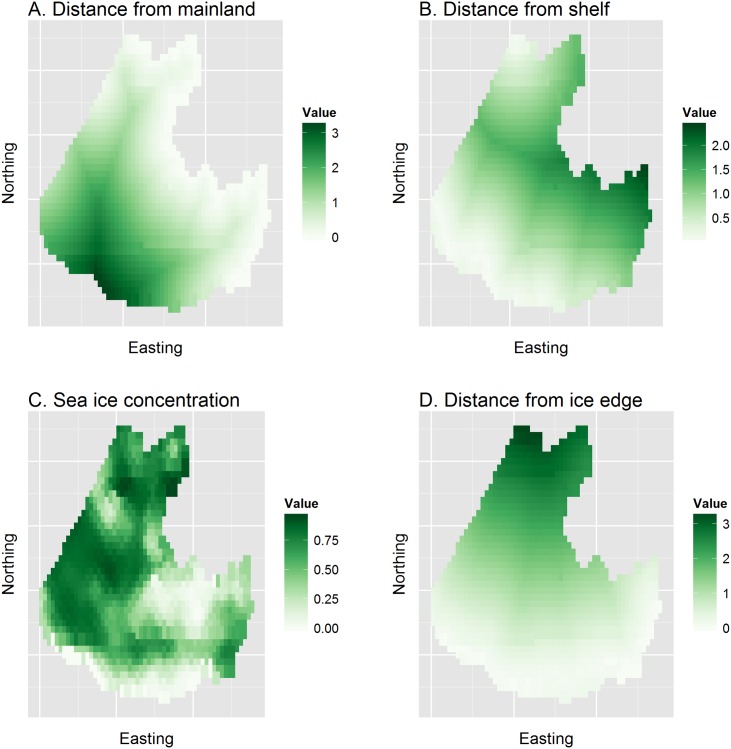
Fig 3. Assembled covariates used to help explain and predict ribbon seal relative abundance in the eastern Bering Sea.
Covariates include distance from mainland (dist_mainland), distance from 1000m depth contour (dist_shelf), average remotely sensed sea ice concentration while surveys were being conducted (ice_conc), and distance from the southern sea ice edge (dist_edge). All covariates except ice concentration were standardized to have a mean of 1.0 prior to plotting and analysis.

