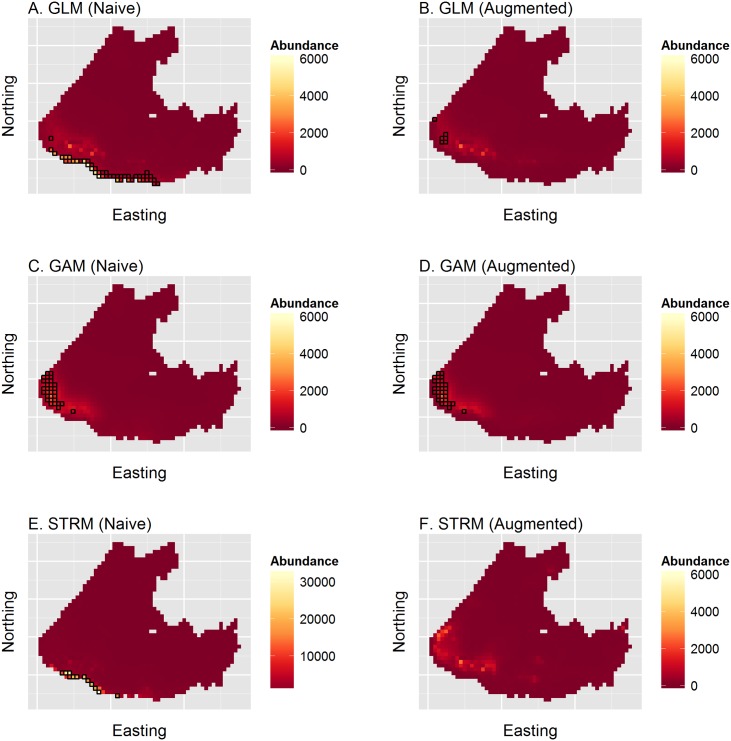
Fig 5. Predictions of ribbon seal apparent abundance across the eastern Bering sea from models fit to survey data.
Predictions were obtained using the posterior predictive mean for GLM and STRM models, and for the GAM using the predict.gam function in the R mgcv package [7]. Each row gives result for different model types (GLM, GAM, or STRM, respectively); left column plots give results for naive runs without presumed absences, while plots in the right column give predictions for runs where presumed absence data (i.e., 0 counts in cells with <0.1% ice) were included. Cells highlighted in black indicate those where predictions were outside the generalized independent variable hull (gIVH).

