Figure 5.

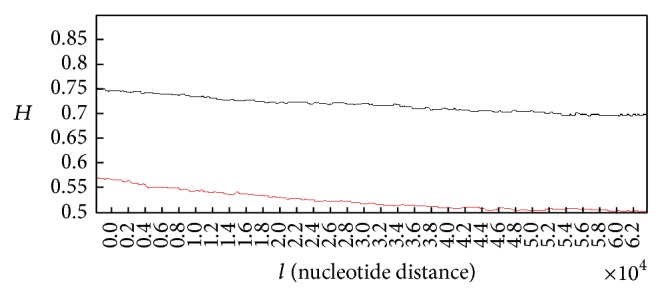
Grand average of the Hurst exponent plots for damaged DNA walks for all of the healthy subjects (black curve) versus grand average of the Hurst exponent plots for damaged DNA walks for all of subjects with lung cancer (red curve).

Grand average of the Hurst exponent plots for damaged DNA walks for all of the healthy subjects (black curve) versus grand average of the Hurst exponent plots for damaged DNA walks for all of subjects with lung cancer (red curve).