Figure 2.

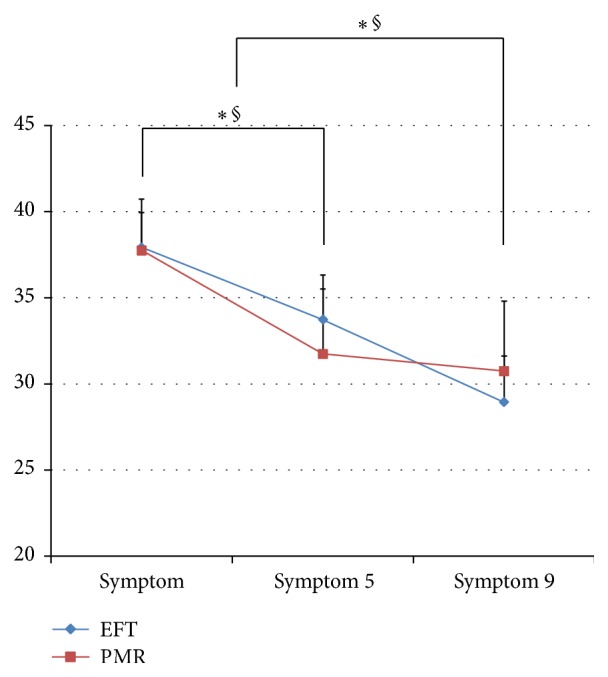
The Hwabyung symptom scale compared between the EFT and PMR groups over time. ∗ = p < 0.05 (EFT group); § = p < 0.05 (PMR group); symptom: baseline survey; symptom 5; 5th week survey; symptom 9: 9th week survey.

The Hwabyung symptom scale compared between the EFT and PMR groups over time. ∗ = p < 0.05 (EFT group); § = p < 0.05 (PMR group); symptom: baseline survey; symptom 5; 5th week survey; symptom 9: 9th week survey.