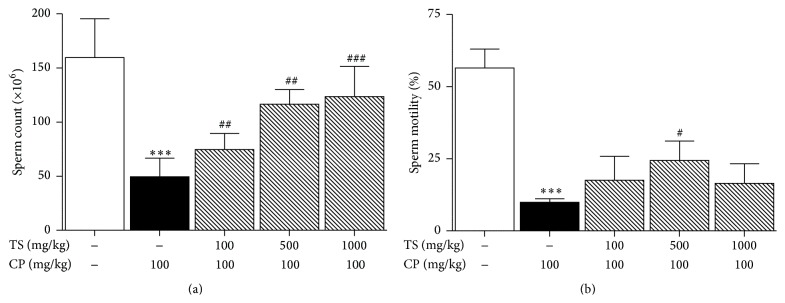
Figure 1.

Effect of TS and CP on sperm count and motility. Normal, vehicle-treated group. Control, CP (100 mg/kg/week, i.p. 5 weeks) treated group. The CP and TS groups received CP (100 mg/kg) and TS (100, 500, and 1000 mg/kg, p.o., 5 weeks). (a) Sperm cell count and (b) sperm motility. Each column represents the mean ± SD (n = 5). ∗ means significantly different from the normal value ( ∗∗∗ p < 0.001). # indicates that the mean is significantly different from the control value ( # p < 0.05, ## p < 0.01, and ### p < 0.001).
