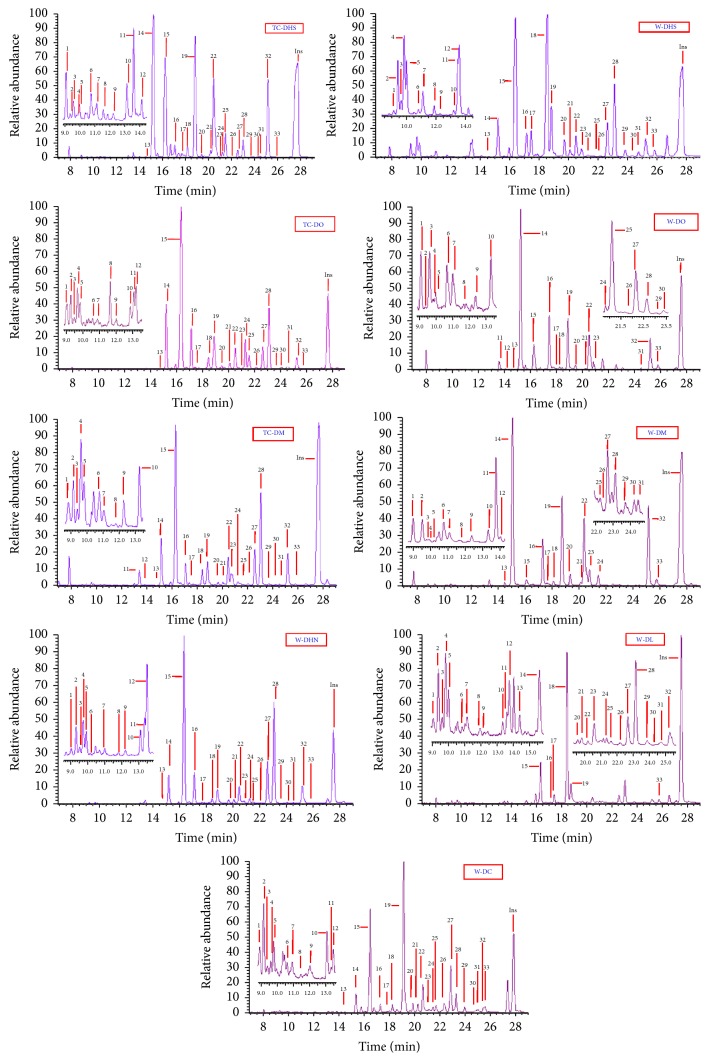
Figure 2.
GC-MS comparison of the monosaccharides in the polysaccharides from the nine Dendrobium samples by TMS methyl method. Arabinose (peaks 1, 2, 5, 6, and 8), rhamnose (peaks 3, 4, 7, and 9), xylose (peaks 10–13), mannose (peaks 14–16 and 19), galactose (peaks 17, 18, 20, and 21), glucose (peaks 22, 28, 29, and 32), galacturonic acid (peaks 23–26, 30, and 31), and fucose (peaks 27 and 33).

