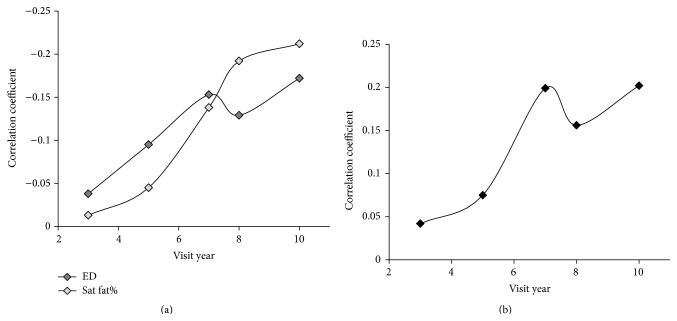
Figure 1.
Spearman's rho correlation coefficients. (a) Correlation between habitual physical activity and average energy density (ED) and dietary saturated fat percent (Sat fat %) by visit year. (b) Correlation between habitual physical activity and fiber intake by visit year. Correlation is significant (two-tailed t, P < 0.001) for years 5, 7, 8, and 10 for correlation with ED and fiber, and for years 7, 8, and 10 for correlation with Sat fat %.

