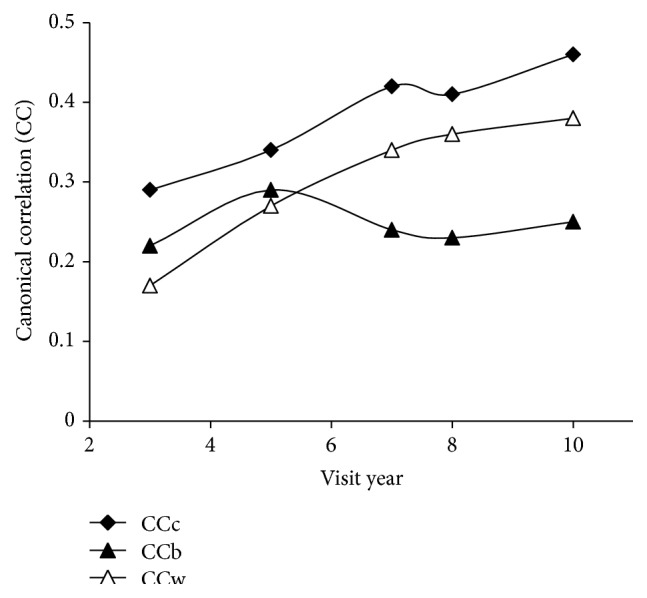
Figure 2.

Canonical correlation of physical activity and confounders with diet quality indicators by visit year. Physical activity and confounders: income category, race, maturation stage, height, weight, habitual physical activity questionnaire score (HAQ), 3-day activity diary score (3d AD), racial interaction HAQ, and racial interaction 3d AD; diet quality indicators: average energy density, average caloric intake, average dietary saturated fat percent, and average fiber intake. Lines represent stratified data from black (CCb) and white (CCw) girls and combined (CCc) data.
