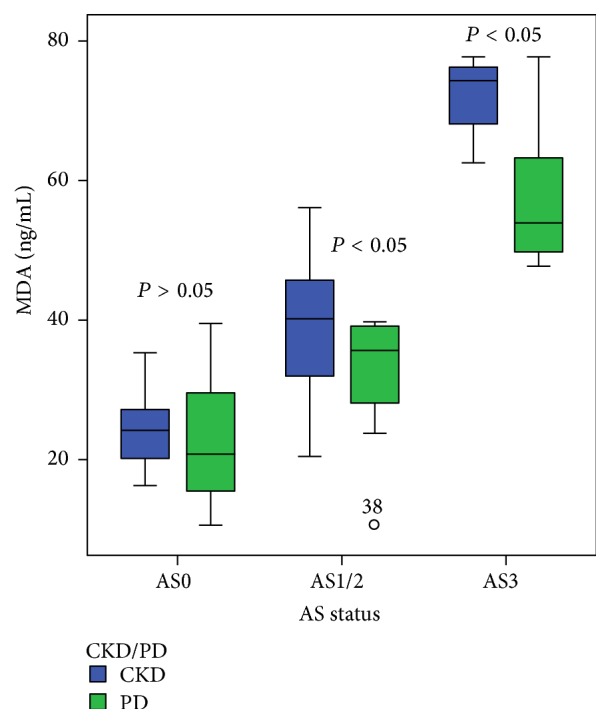
Figure 1.

The relationship between serum concentrations of MDA in CKD nondialysis-dependent patients and PD patients according to the stage of atherosclerotic changes in the carotid arteries. Data are presented as median with interquartile range. Bars show the maximum and minimum value, while the square and its central bar show median and interquartile range. Note: AS: atherosclerosis.
