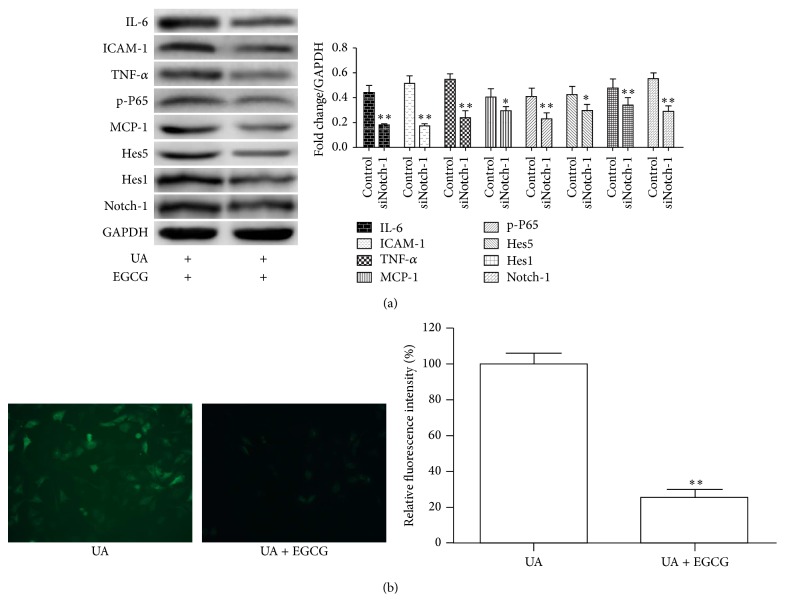
Figure 4.
A cell model illustrating cardioprotection of EGCG on UA-induced inflammatory reaction and oxidative stress in HUVEC. (a) Immunoblot analysis reporting the protein levels of Notch1, IL-6, MCP-1, ICAM-1, TNF-α, Hes1, Hes5, and p-P65 in whole cell lysates of HUVEC with treatment as indicated. (b) Representative fields of intracellular ROS production in HUVEC treated with UA with or without EGCG. Corresponding densitometric analysis showed the relative ROS production. ∗∗ P < 0.01.

