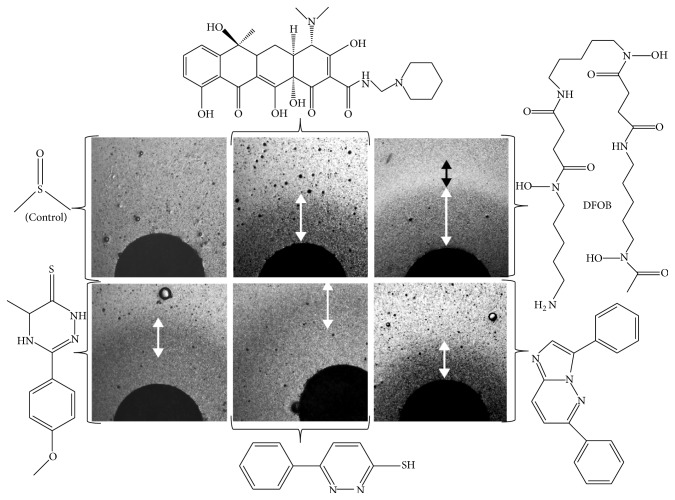
Figure 3.
Dose-dependent effect of some drugs evaluated by agar diffusion assays. The agar diffusion disk assays were performed as described in Figure 2. White double arrows represent zones of growth improvement whereas black double arrows represent zones of growth inhibition. Pictures are shown in negative to highlight the contrast. Chemical used were from left to right upper panel DMSO (as a control), rolitetracycline (not evaluated further), and desferrioxamine B (DFOB) and lower panel LPS02-25-L-E10, LPS01-03-L-F03, and LPS02-30-L-H10.

