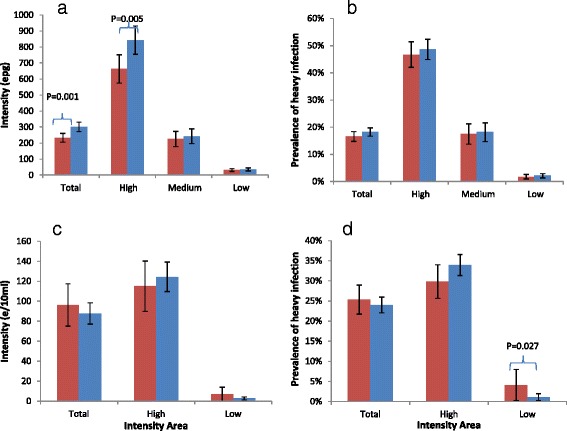
Fig. 3.

Differences in infection markers between those individuals followed up in the longitudinal cohort for all years (red bars), and those lost to follow-up (blue bars): a Mean infection intensity of Schistosoma mansoni in Uganda at baseline; b Prevalence of heavy intensity (≥400 epg) of S. mansoni in Uganda at baseline; c Mean infection intensity of S. haematobium in Burkina Faso at baseline; d Prevalence of heavy intensity (≥50 eggs/10 ml urine) of S. haematobium in Burkina Faso at baseline. P-Values are stated where differences are statistically significant (P ≤ 0.05), otherwise they are omitted
