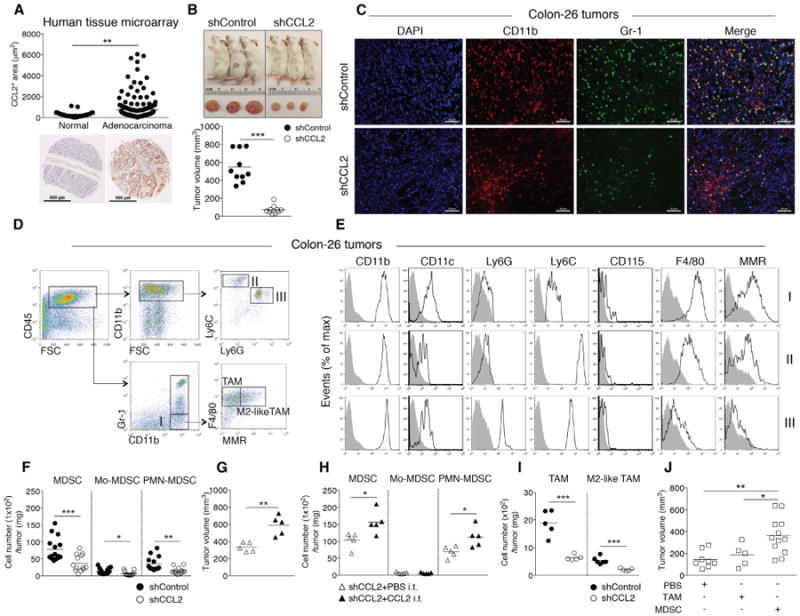
Figure 3. CCL2 Levels Increase in Human Sporadic CRC and CCL2 Enhances Tumor MDSC Accumulation during Colonic Adenocarcinoma Growth.

(A) CCL2 levels in human colon adenocarcinoma tissue microarrays (normal, n = 29; adenocarcinoma, n = 119). Representative images are shown. Scale bar, 500 μm.
(B-F) Colon26shGFP (shControl) or Colon26shCCL2-2 (shCCL2) cells were subcutaneously injected into BALB/c mice and tumor growth evaluated at day14. (B) Representative images of tumor-bearing mice (upper panel) and tumor volumes (lower panel). (C) Representative immunofluorescence microscopy images. Tumors were stained with DAPI and for CD11b and Gr-1; single-channel and pseudocolored images. Scale bar, 50 μm. (D) Flow cytometry gating strategy and (E) analysis of intratumoral Mo-MDSCs, PMN-MDSCs, and CD11b+Gr-1− myeloid cells. (F) Intratumoral MDSC, PMN-MDSC, and Mo-MDSC numbers from shControl versus shCCL2 tumor-bearing mice with cell numbers normalized by tumor weight. Symbols represent individual mice.
(G and H) shCCL2 cells were subcutaneously injected into mice and recombinant CCL2 or PBS was intratumorally injected into shCCL2 tumor-bearing mice at day 5 and day 12. Tumor volumes at day 19 (G). Intratumoral MDSC, PMN-MDSC, and Mo-MDSC numbers normalized by tumor weight (H).
(I) Intratumoral TAM and M2-like-TAM cell numbers.
(J) shCCL2 cells were subcutaneously injected into mice, and then sorted TAMs or MDSCs from spleens of shControl tumor-bearing mice were intratumorally injected into shCCL2 tumor-bearing mice at day 5. Tumor volumes were evaluated at day 14.
All data reflect at least three independent experiments. *p < 0.05, **p < 0.01, and ***p < 0.001 (unpaired, two-tailed Student's t test). See also Figure S3.
