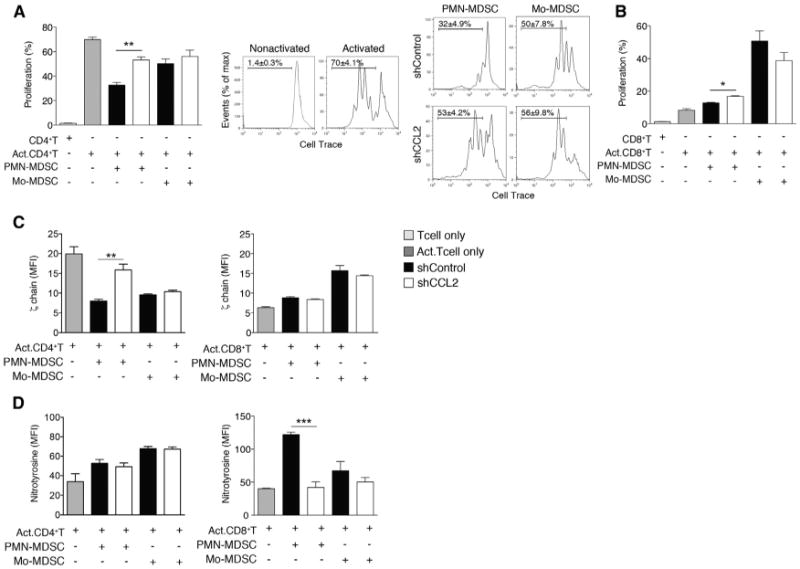
Figure 4. CCL2 Promotes T Cell Suppression via PMN-MDSCs.

(A and B)T cell proliferation assays. Intratumoral PMN-MDSCs and Mo-MDSCs were sorted from shControl or shCCL2 tumor-bearing mice. (A) CellTrace-labeled splenic CD4+T cells from syngeneic mice were coincubated for 3 days with sorted intratumoral PMN-MDSCs or Mo-MDSCs. Representative flow cytometric analyses of activated or nonactivated CD4+ T cell proliferation and activated CD4+ T cell in the presence of sorted MDSCs are shown. Bar graph shows mean ± SEM of three independent experiments. (B) CellTrace-labeled splenic CD8+T cells were coincubated for 3 days with sorted intratumoral PMN-MDSCs or Mo-MDSCs.
(C and D) Suppressive mechanisms of PMN-MDSCs or Mo-MDSCs on TCR components. ζ chain expression (C) and nitrotyrosine levels (D) of CD4+ T cells or CD8+ T cells coincubated with sorted intratumoral PMN-MDSCs or Mo-MDSCs were measured by flow cytometry. Data, shown as MFI ± SEM, reflect three independent experiments.
*p < 0.05, **p < 0.01, and ***p < 0.001 (unpaired, two-tailed Student's t test). See also Figure S4.
