
Figure 7. CCL2 Affects Adenoma Number and MDSC Accumulation in ApcMin/+ Mice.
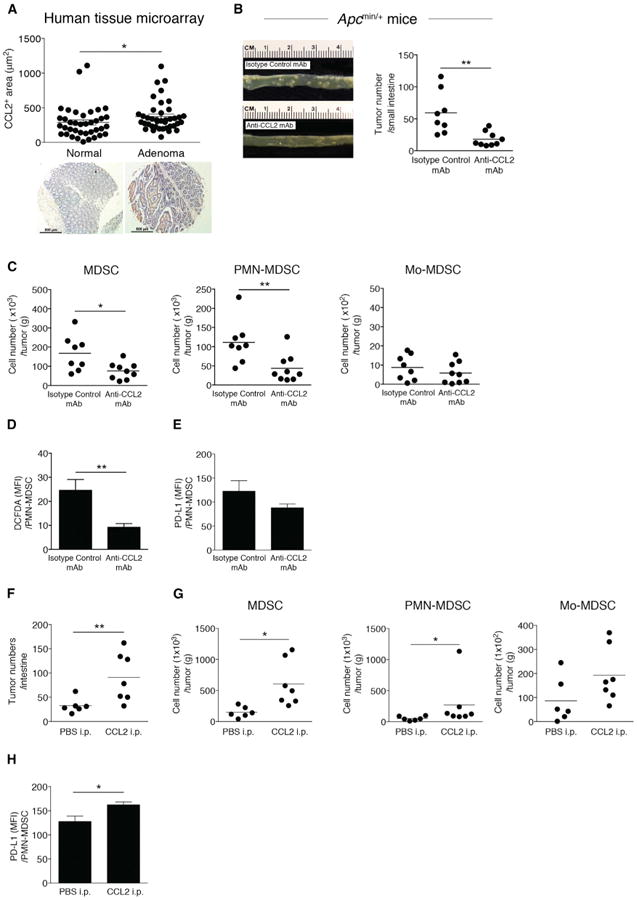
(A) CCL2 levels in human colon adenoma tissue microarrays (normal, n = 38; adenoma, n = 40). Representative images are shown. Scale bar, 500 μm.
(B–E) ApcMin/+ mice were injected with anti-CCL2 or isotype control mAb (10 μg/kg) from 6 to 10 weeks of age twice a week for 4 weeks. (B) Photograph of intestinal tumors from representative mice (left panel). Intestinal tumor counts from ApcMin/+ mice (right panel). Symbols represent data from individual mice.
(C) MDSC, PMN-MDSC, and Mo-MDSC numbers from intestinal tumors from ApcMin/+ mice treated with anti-CCL2 or isotype control mAb, with cell numbers normalized by tumor weight. (D) ROS production levels (DCFDA staining) in intratumoral PMN-MDSCs from ApcMin/+ mice treated with anti-CCL2 or isotype control mAb. (E) Expression of PD-L1 in intratumoral PMN-MDSCs from ApcMin/+ mice treated with anti-CCL2 or isotype control mAb measured by flow cytometry.
(F–H) ApcMin/+ mice were injected with recombinant mouse CCL2 (20 μg/kg) from 6 to 10 weeks of age twice a week for 4 weeks or with PBS as a control. (F) Intestinal tumor counts. (G) Intestinal tumor MDSC, PMN-MDSC, and Mo-MDSC numbers. (H) PD-L1 expression in intratumoral PMN-MDSCs from ApcMin/+ mice treated with recombinant CCL2 or PBS measured by flow cytometry.
All data reflect at least three independent experiments. *p < 0.05 and **p < 0.01 (unpaired, two-tailed Student's t test).