Fig. 5.
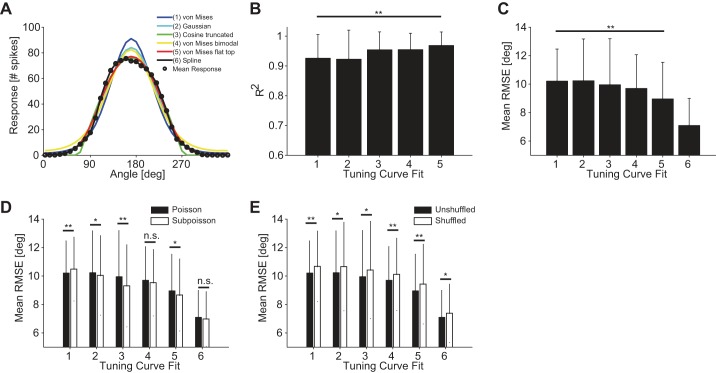
Influence of tuning curve fit on decoding performance. A: various tuning curve fits. The different fit types are indicated in the key by different colors and numbers. B: mean coefficient of determination R2 (10-fold cross-validated) for 126 ON-OFF DSGCs fitted by 5 different functions numbered 1–5 in A. C: average RMSE using 6 different functional fits of the tuning curves. Fits numbered as in A [n = 600 quadruplets, bar size = 0.5 × 1 mm2 (length × width), stimulus velocity = 1.6 mm/s]. Decoding results were obtained by using a Bayesian decoder and Poisson noise assumption. Responses were quantified as the total number of spikes fired by the cell for each stimulus. D: comparison of decoding accuracies for Poisson and sub-Poisson noise assumptions across all tuning curve fits [n = 600 quadruplets, bar size = 0.5 × 1 mm2 (length × width), stimulus velocity = 1.6 mm/s]. Decoding results were obtained by using a Bayesian decoder, and responses were quantified as the total number of spikes fired by the cell for each stimulus. E: comparison of decoding accuracies between unshuffled and shuffled trials across all tuning curve fits [n = 600 quadruplets, bar size = 0.5 × 1 mm2 (length × width), stimulus velocity = 1.6 mm/s]. Decoding results were obtained by using a Bayesian decoder and Poisson noise assumption. Responses were quantified as the total number of spikes fired by the cell for each stimulus. Error bars indicate SD in all panels. *P < 0.05; **P < 0.01.

